

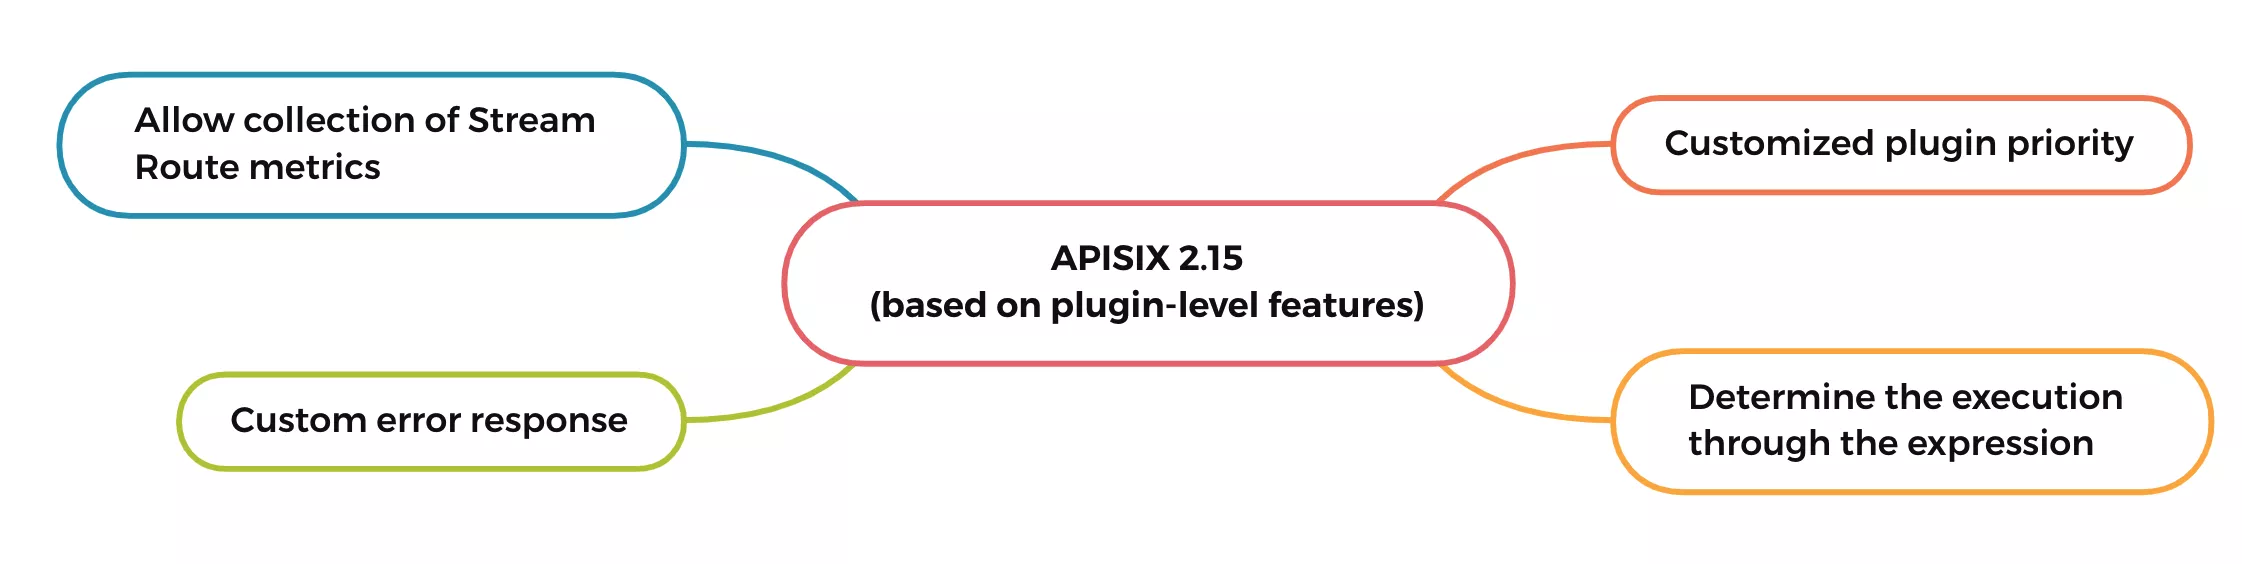
Apache APISIX 2.15 is officially released! You can customize plugin priority and whether the plugin is executed, custom error response, and indicators to support the monitoring of four layers of traffic.
Since the first 2.0 version was released two years ago, APISIX has released 15 minor versions and many patch versions. As the last minor version of the 2.x series, version 2.15 can be said to be a link between the previous and the next.
"Link" is because this version continues to introduce more functions, making plugin configuration more flexible, and also will be the last LTS version of version 2.x. Later APISIX will be moving to version 3.0 in the future. Let's see below for more details!

Custom plugin priority
The new version allows users to customize the priority of the plugin instead of directly applying the plugin's default priority properties.
With this feature, we can adjust the execution order of several plugins on a specific route, thus breaking the constraints of the previous plugin priority properties.
By default, the serverless-post-function plugin is executed after the serverless-pre-function plugin. But with this feature, the serverless-post-function plugin can be made to execute first. A configuration example is as follows:
 {
    "serverless-post-function": {
        "_meta": {
            "priority": 10000
        },
        "phase": "rewrite",
        "functions" : ["return function(conf, ctx)
                    ngx.say(\"serverless-post-function\");
                    end"]
    },
    "serverless-pre-function": {
        "_meta": {
            "priority": -2000
        },
        "phase": "rewrite",
        "functions": ["return function(conf, ctx)
                    ngx.say(\"serverless-pre-function\");
                    end"]
    }
}
note
If a plugin configuration does not indicate priority, it is sorted by the priority property value in the plugin code.
If you specify the priority of the plugin in the plugin configuration of the Service or Plugin Config, it will still take effect after merging into the route.
Custom plugin whether to execute
In addition to being able to adjust the execution order, you can also dynamically decide whether the plugin needs to be executed. In version 2.15, a plugin configuration level filter was introduced, and the execution result of the filter controls whether the plugin executes or not.
In the configuration below, the http-logger plugin will only be executed if the variable $status is greater than or equal to 400. This way, only 4xx and 5xx requests will be reported to the remote HTTP log server.
{
    "http-logger": {
        "_meta": {
            "filter": {
                {"status", "!", "<", "400"}
            }
        },
        ...
    }
}
At the same time, with the help of another function of APISIX custom variables, you can play more tricks. For example, if the client-side address is an intranet address, skip a scene such as Logger.
Custom error response
This function is also a new function configured at the specific plugin level, which belongs to the error message at the plugin configuration level.
This feature can come in handy if the requester requires an error response on a specific route. No matter what the plugin is, this configuration can set a fixed response result, avoiding the trouble caused by the built-in error response information of the plugin.
As shown in the configuration below, whatever error message the jwt-auth plugin returns will be rewritten as "Missing credential in request" and returned to the client side.
{
    "jwt-auth": {
        "_meta": {
            "error_response": {
                "message": "Missing credential in request"
            }
        }
    }
}
Allow collection of metrics on Stream Route
A major change in this release is to allow metrics to be collected on Stream Route and exposed through the Prometheus interface.
This feature is turned off by default, if you need to enable it, build on the APISIX-Base version and enable the prometheus plugin in config.yaml, an example is as follows:
stream_plugins:
  - ...
  - prometheus
When the plugin is enabled, even if only APISIX is used to proxy TCP traffic on Layer 4, it will specifically listen on port 9091 in response to HTTP requests from Prometheus.
As with the prometheus plugin in the HTTP proxy subsystem section, the next step is to configure the plugin on the Stream Route that needs to collect metrics:
curl http://127.0.0.1:9080/apisix/admin/stream_routes/1 \
-H 'X-API-KEY: edd1c9f034335f136f87ad84b625c8f1' -X PUT -d '
{
    "plugins": {
        "prometheus":{}
    },
    "upstream": {
        "type": "roundrobin",
        "nodes": {
            "127.0.0.1:80": 1
        }
    }
}'
After connecting to the Stream Route, you can click http://127.0.0.1:9091/apisix/prometheus/metrics to see the following TCP proxy statistics:
...
# HELP apisix_node_info Info of APISIX node
# TYPE apisix_node_info gauge
apisix_node_info{hostname="desktop-2022q8f-wsl"} 1
# HELP apisix_stream_connection_total Total number of connections handled per stream route in APISIX
# TYPE apisix_stream_connection_total counter
apisix_stream_connection_total{route="1"} 1
At present, this function only realizes the number of statistical connections, and more statistical indicators will be added as needed in the future.
In addition to the normal Stream Route, this version also provides statistical indicators for the Redis proxy function under xRPC. Such as command count indicators broken down by Route and Command apisix_redis_commands_total and delay time indicators apisix_redis_commands_latency_seconds_bucket.
More features
At the level of new features, in addition to the several functions mentioned above, this version also contains many detailed changes:
- Supports Upstream objects to reference certificates from SSL objects
prometheusavailable in thengx.shared.dictstatisticsopenid-connectplugin supports PKCE extension
For more specific release details, please refer to 2.15 Changelog.