This article aims to elucidate how to leverage DeepFlow's zero-code feature based on eBPF to construct an observability solution for APISIX.
With the growing emphasis on the observability of application components, Apache APISIX has introduced a plugin mechanism to enrich observability signals. However, these data are scattered across multiple stacks, creating data silos. This article aims to elucidate how to leverage DeepFlow's zero-code feature based on eBPF to construct an observability solution for APISIX. On this basis, it integrates the rich data sources of existing APISIX plugins to eliminate data silos and build an all-in-one platform for comprehensive observability of the APISIX gateway.
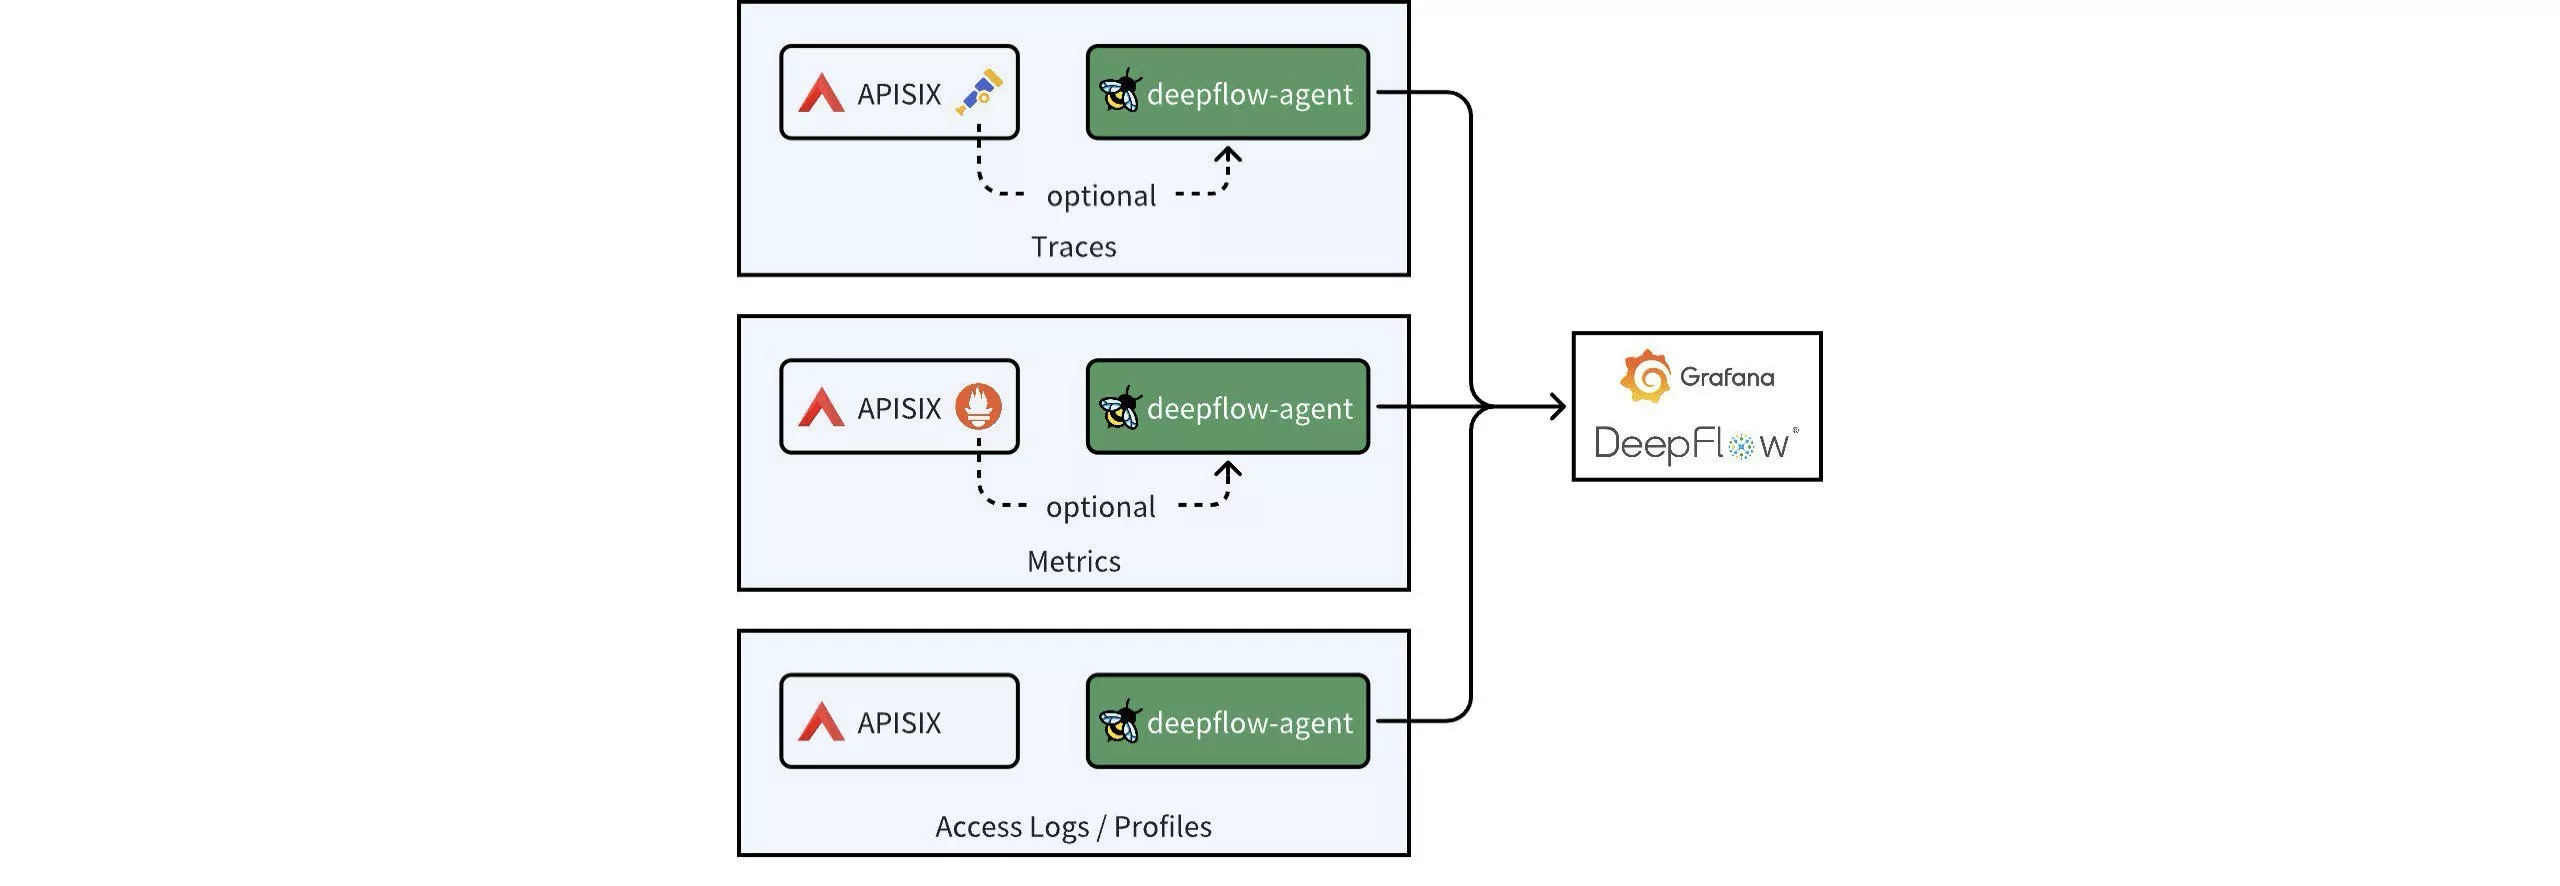
Through DeepFlow, APISIX can achieve comprehensive observability from traffic monitoring and tracing analysis to performance optimization, eliminating data dispersion and providing a centralized view. This accelerates fault diagnosis and performance tuning, making the work of DevOps and SRE teams more efficient. This article will focus on how APISIX's tracing data, metric data, access logs, and performance profiling data can be integrated with DeepFlow.

1. Install APISIX and DeepFlow
For convenience, this article describes deploying both DeepFlow and APISIX as Kubernetes services, with the entire deployment process taking approximately 5 minutes. For detailed deployment steps, refer to the DeepFlow and APISIX official deployment documentation.
Note: To leverage DeepFlow's observability capabilities that utilize eBPF technology, your host's Linux kernel must be version 4.14 or higher.
2. Distributed Tracing
There are two approaches to implementing distributed tracing for APISIX and backend services using DeepFlow: Firstly, DeepFlow leverages eBPF to enable out-of-the-box, RPC-level distributed tracing for APISIX and backend services, requiring no code changes. Secondly, if backend services have APM (Application Performance Monitoring) tools like OpenTelemetry or SkyWalking enabled, you can integrate all tracing data into DeepFlow using the APISIX Tracers plugin. This enables comprehensive, end-to-end tracing at the application function level.
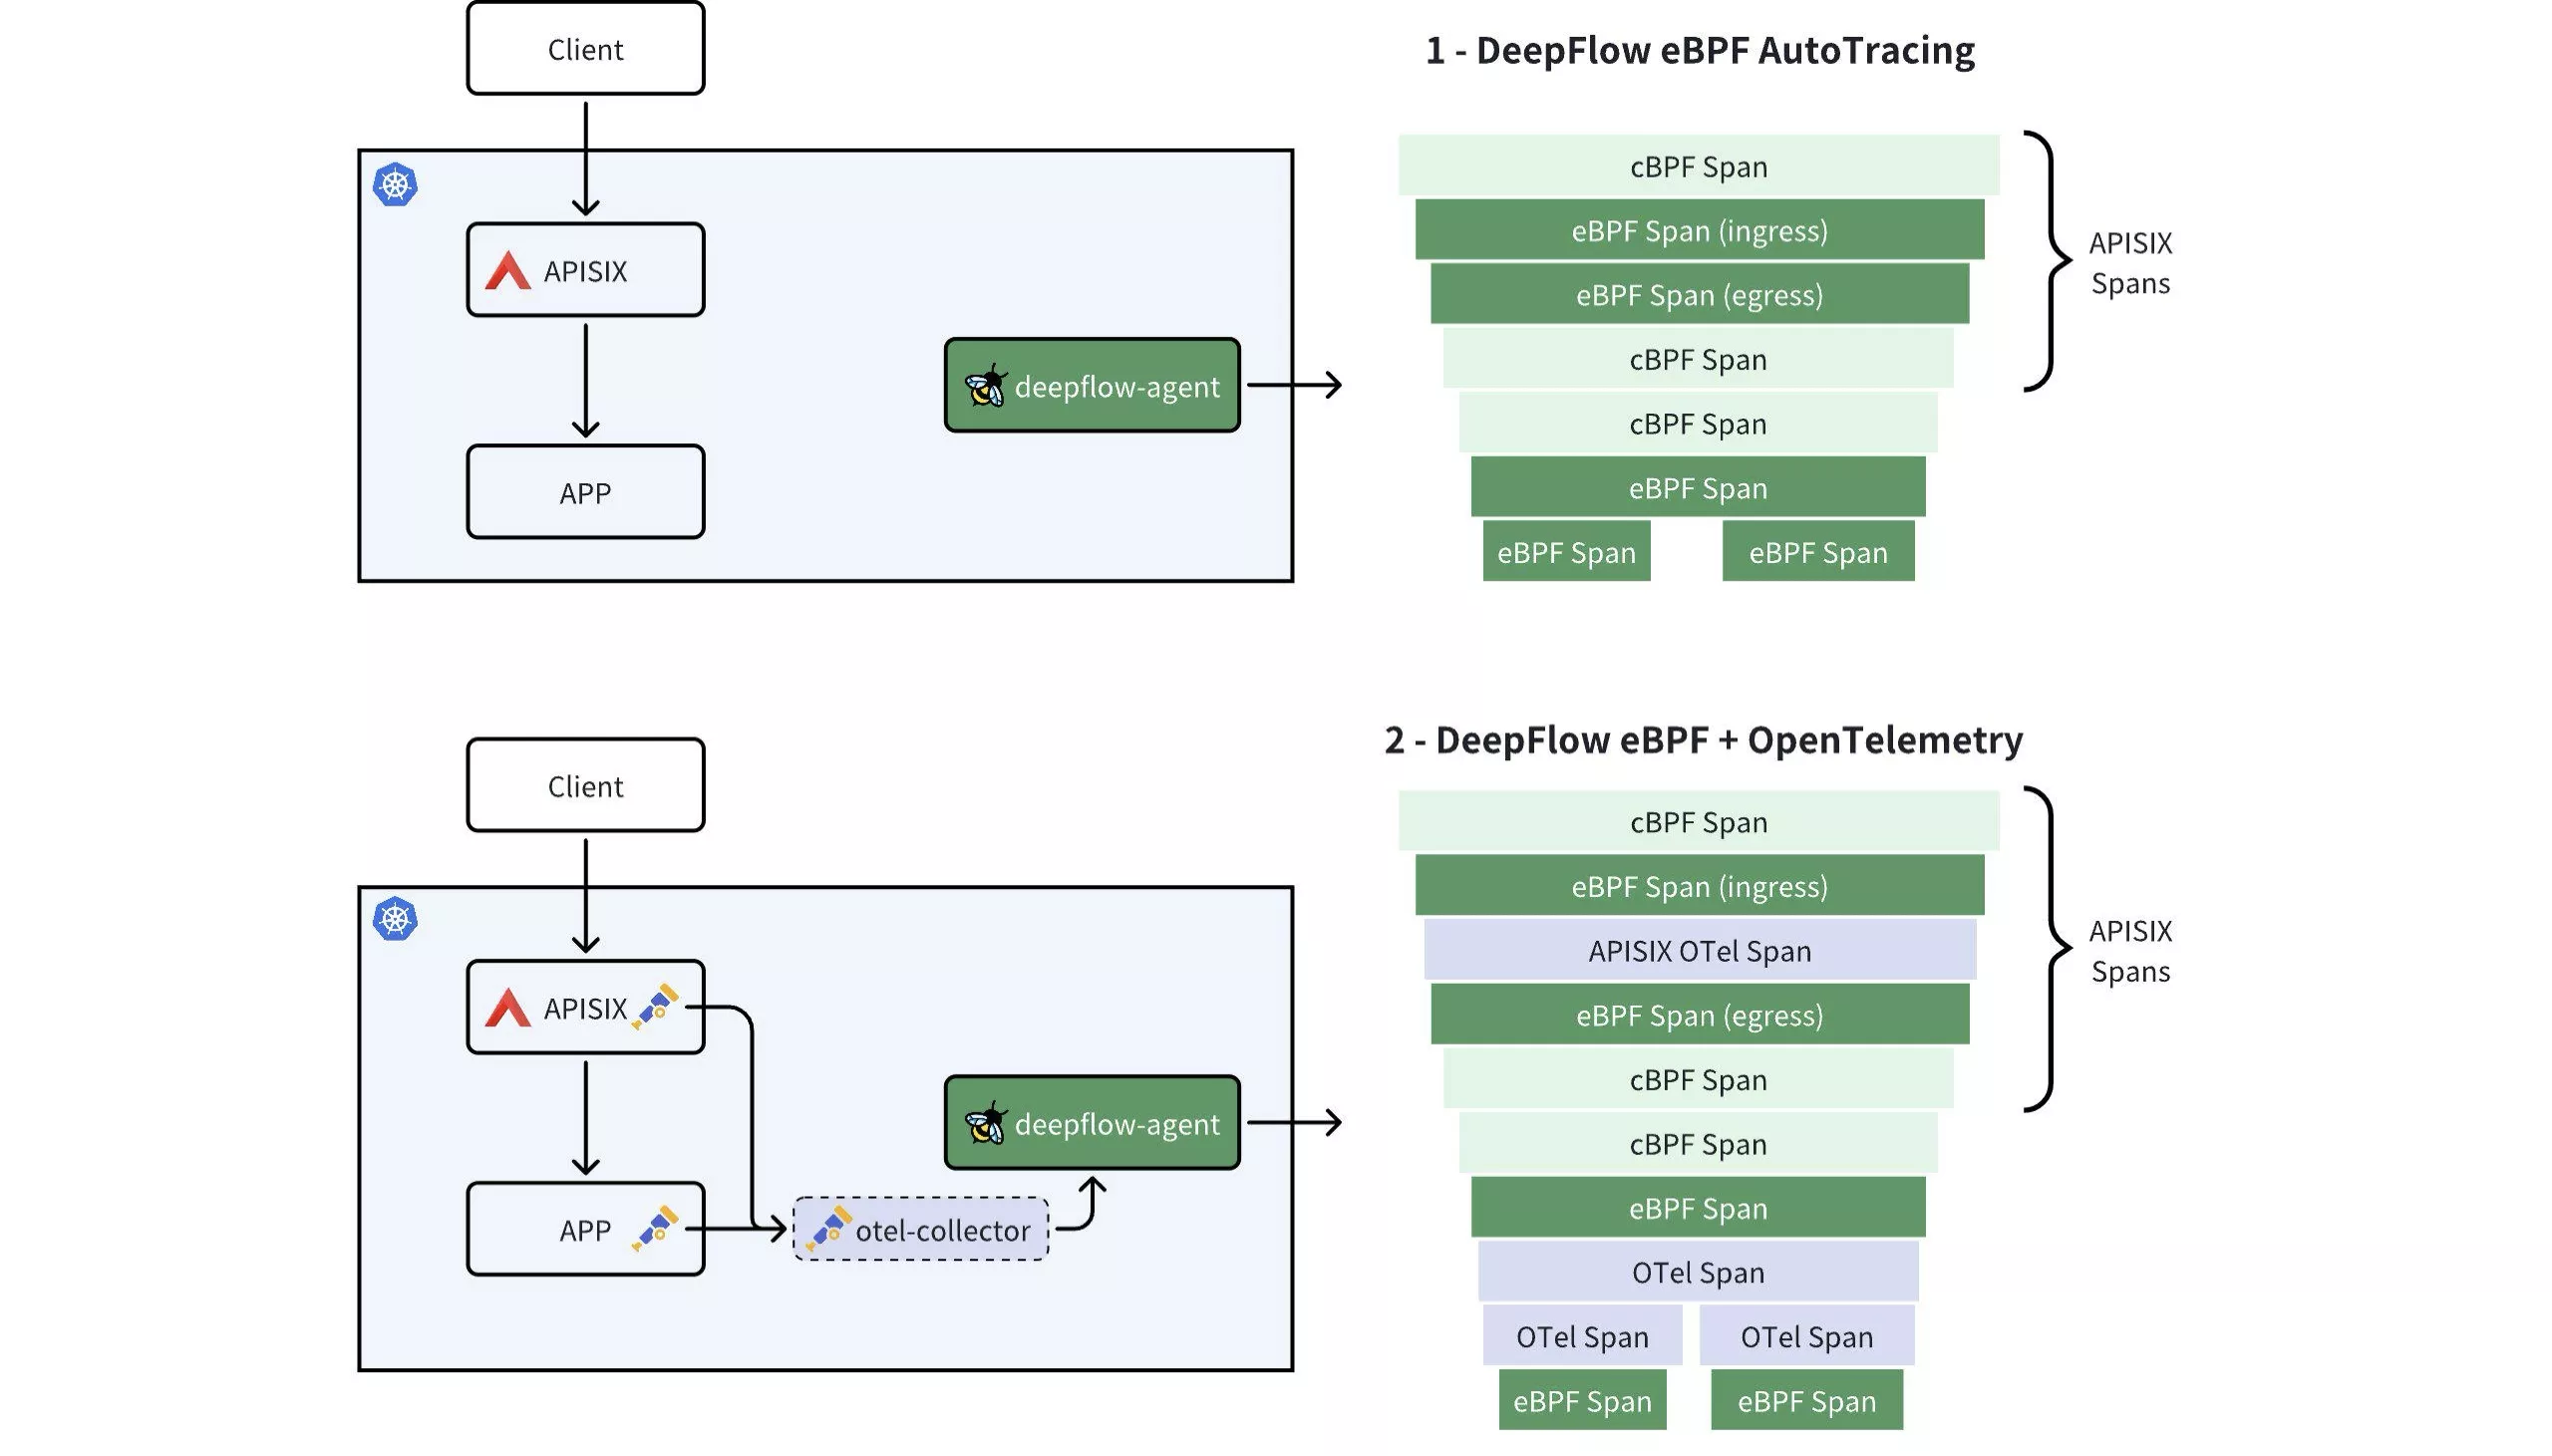

2.1 DeepFlow eBPF AutoTracing
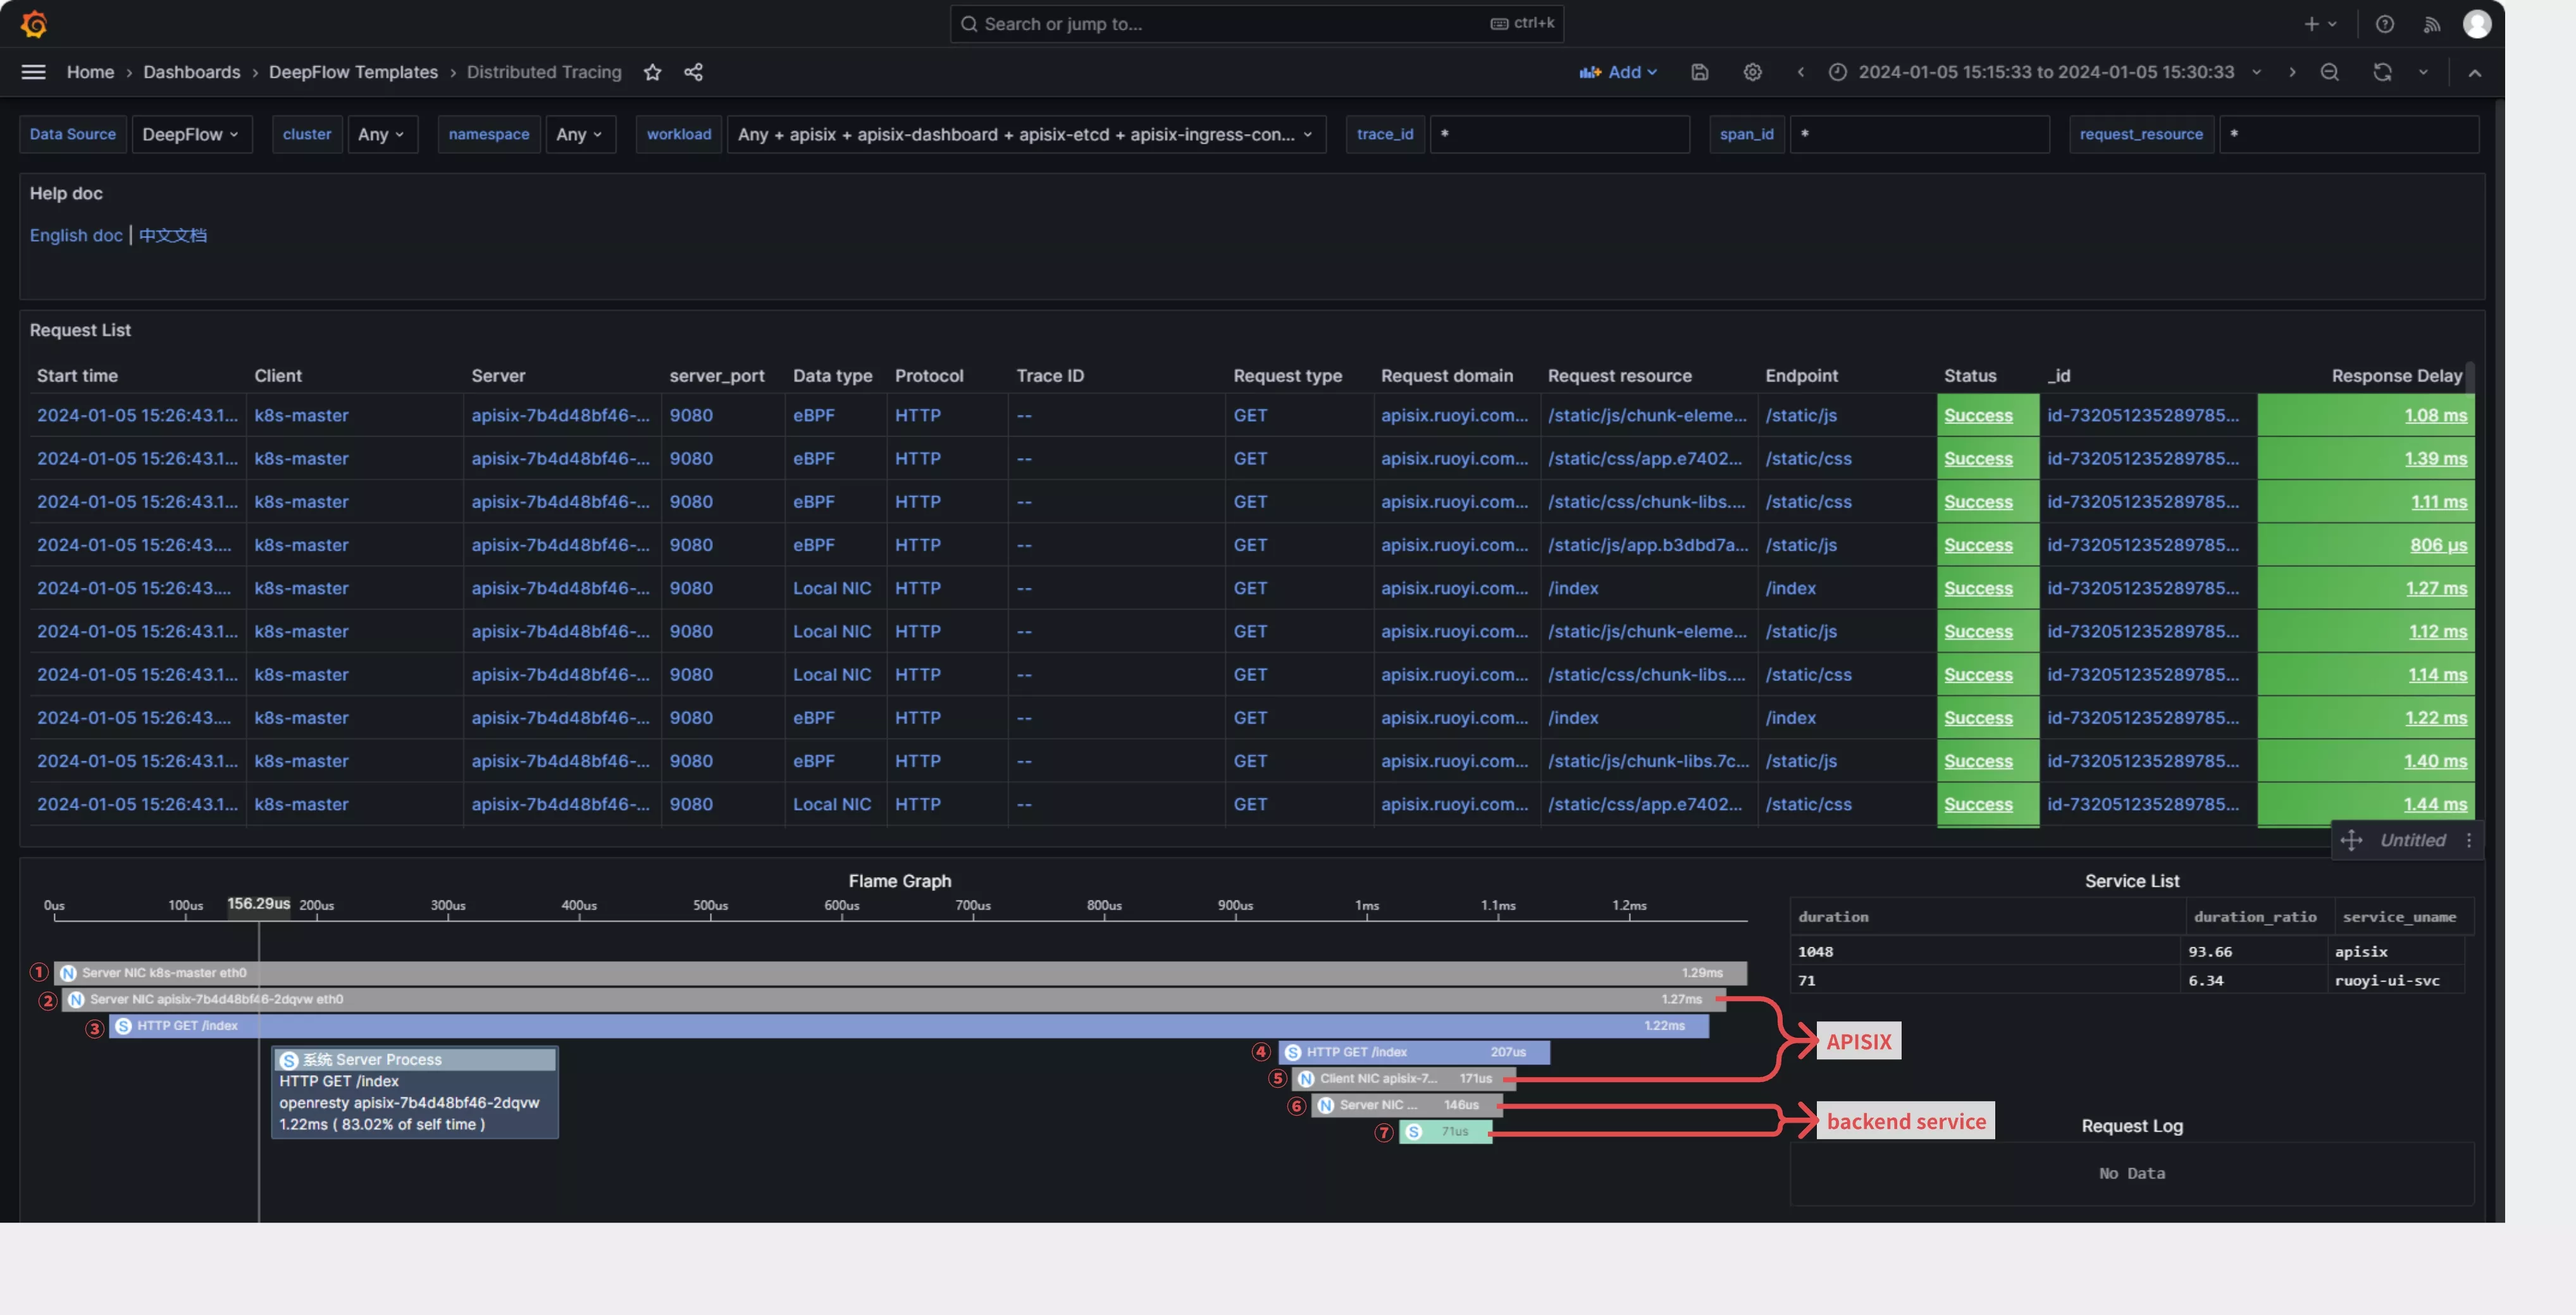
DeepFlow offers out-of-the-box distributed tracing (AutoTracing) that requires no APISIX plugins or code changes to be enabled. It only necessitates deploying the deepflow-agent on the server where APISIX is located. In Grafana, find the Distributed Tracing Dashboard provided by DeepFlow, where you can initiate a trace on a specific request and see the end-to-end trace of that request in both APISIX and its backend services, as illustrated below:
- (1): Accesses the APISIX gateway service on the K8s Node NIC via nodeport.
- (2): Enters the NIC of the POD corresponding to the APISIX gateway service.
- (3): Goes into the OpenResty process within the APISIX gateway service.
- (4): The request is forwarded to the backend service by the OpenResty process.
- (5): Forwarded by the NIC of the POD corresponding to the APISIX gateway service.
- (6)/(7): Forwarded to the backend service.

2.2 DeepFlow eBPF + OpenTelemetry
This approach involves APISIX generating trace data using the OpenTelemetry plugin, while the backend service also has APM capabilities and can convert generated trace data into the OpenTelemetry format. When APISIX and backend services both send trace data to DeepFlow, it can create a comprehensive trace-tree without any blind spots, incorporating APM application SPAN, eBPF system SPAN, and cBPF network SPAN.
This method is ideal for achieving function-level distributed tracing inside the application process or when the backend service uses a thread pool for call handling, which may disrupt DeepFlow AutoTracing.
2.2.1 Deploy Backend Services with APM Enabled
To demonstrate the full tracing effect, we first deploy a demo application behind the APISIX gateway that supports OpenTelemetry. The deployment of the Demo application can refer to: "DeepFlow Demo - One-click deployment of a WebShop application composed of five microservices written in Spring Boot". Create a route on APISIX to access the backend service, with the access domain being apisix.deepflow.demo.
apiVersion: apisix.apache.org/v2
kind: ApisixRoute
metadata:
  name: deepflow-apisix-demo
  namespace: deepflow-otel-spring-demo
spec:
  http:
    - name: deepflow-apisix-demo
      match:
        hosts:
          - apisix.deepflow.demo
        paths:
          - "/*"
      backends:
        - serviceName: web-shop
          servicePort: 18090
2.2.2 Enable the OpenTelemetry Plugin in APISIX
Add OpenTelemetry plugins to the APISIX configuration:
## vim ./apisix/.values.yaml
plugins:
  - opentelemetry
#...
pluginAttrs:
  opentelemetry:
    resource:
      service.name: APISIX
    collector:
      ## Send data to deepflow-agent
      ## Of course, you can also send it to otel-collector for processing, and then have otel-collector forward it to deepflow-agent
      address: deepflow-agent.deepflow.svc.cluster.local/api/v1/otel/trace
      request_timeout: 3

## After adding, update helm upgrade --install -n apisix apisix ./apisix
Enable OpenTelemetry functionality for a specific route:
## View router id
## Find the router id for the domain
curl -s http://10.109.77.186:9180/apisix/admin/routes -H 'X-API-KEY: This is apisix-admin token' | jq
## Enable the otel feature for a specific route
curl http://10.109.77.186:9180/apisix/admin/routes -H 'X-API-KEY: This is apisix-admin token' -X PUT -d '
{
    "name": "deepflow-apisix-demo",            ## Assign a name to this route
    "methods": ["GET"],
    "uris": ["/*"],
    "plugins": {
        "opentelemetry": {
            "sampler": {
                "name": "always_on"
            },
            "additional_attributes": [        ## Customize tags for span through `additional_attributes`
                "deepflow=demo"
            ]
        }
    },
    "upstream": {
        "type": "roundrobin",                 ## Round Robin Load Balancing
        "nodes": {                            ## Upstream Address
            "10.1.23.200:18090": 1            ## Service access address: Upstream ID
        }
    }
}'
2.2.3 Using DeepFlow to Integrate OpenTelemetry Traces
The integration of OpenTelemetry Span data through DeepFlow Agent is enabled by default and requires no additional configuration.
## View the default configuration of deepflow-agent
## deepflow-ctl agent-group-config example

## This parameter controls whether to enable receiving data from external sources, including Prometheus, Telegraf, OpenTelemetry, and SkyWalking.
## Data Integration Socket
## Default: 1. Options: 0 (disabled), 1 (enabled).
## Note: Whether to enable receiving external data sources such as Prometheus,
##   Telegraf, OpenTelemetry, and SkyWalking.
#external_agent_http_proxy_enabled: 1
2.2.4 OpenTelemetry Integration Showcase
We initiate a command from the client to access the WebShop service:
curl -H "Host: apisix.deepflow.demo" 10.1.23.200:44640/shop/full-test
## Here, the IP is the K8s cluster node IP, and port 44640 is the NodePort exposed by APISIX 9180.
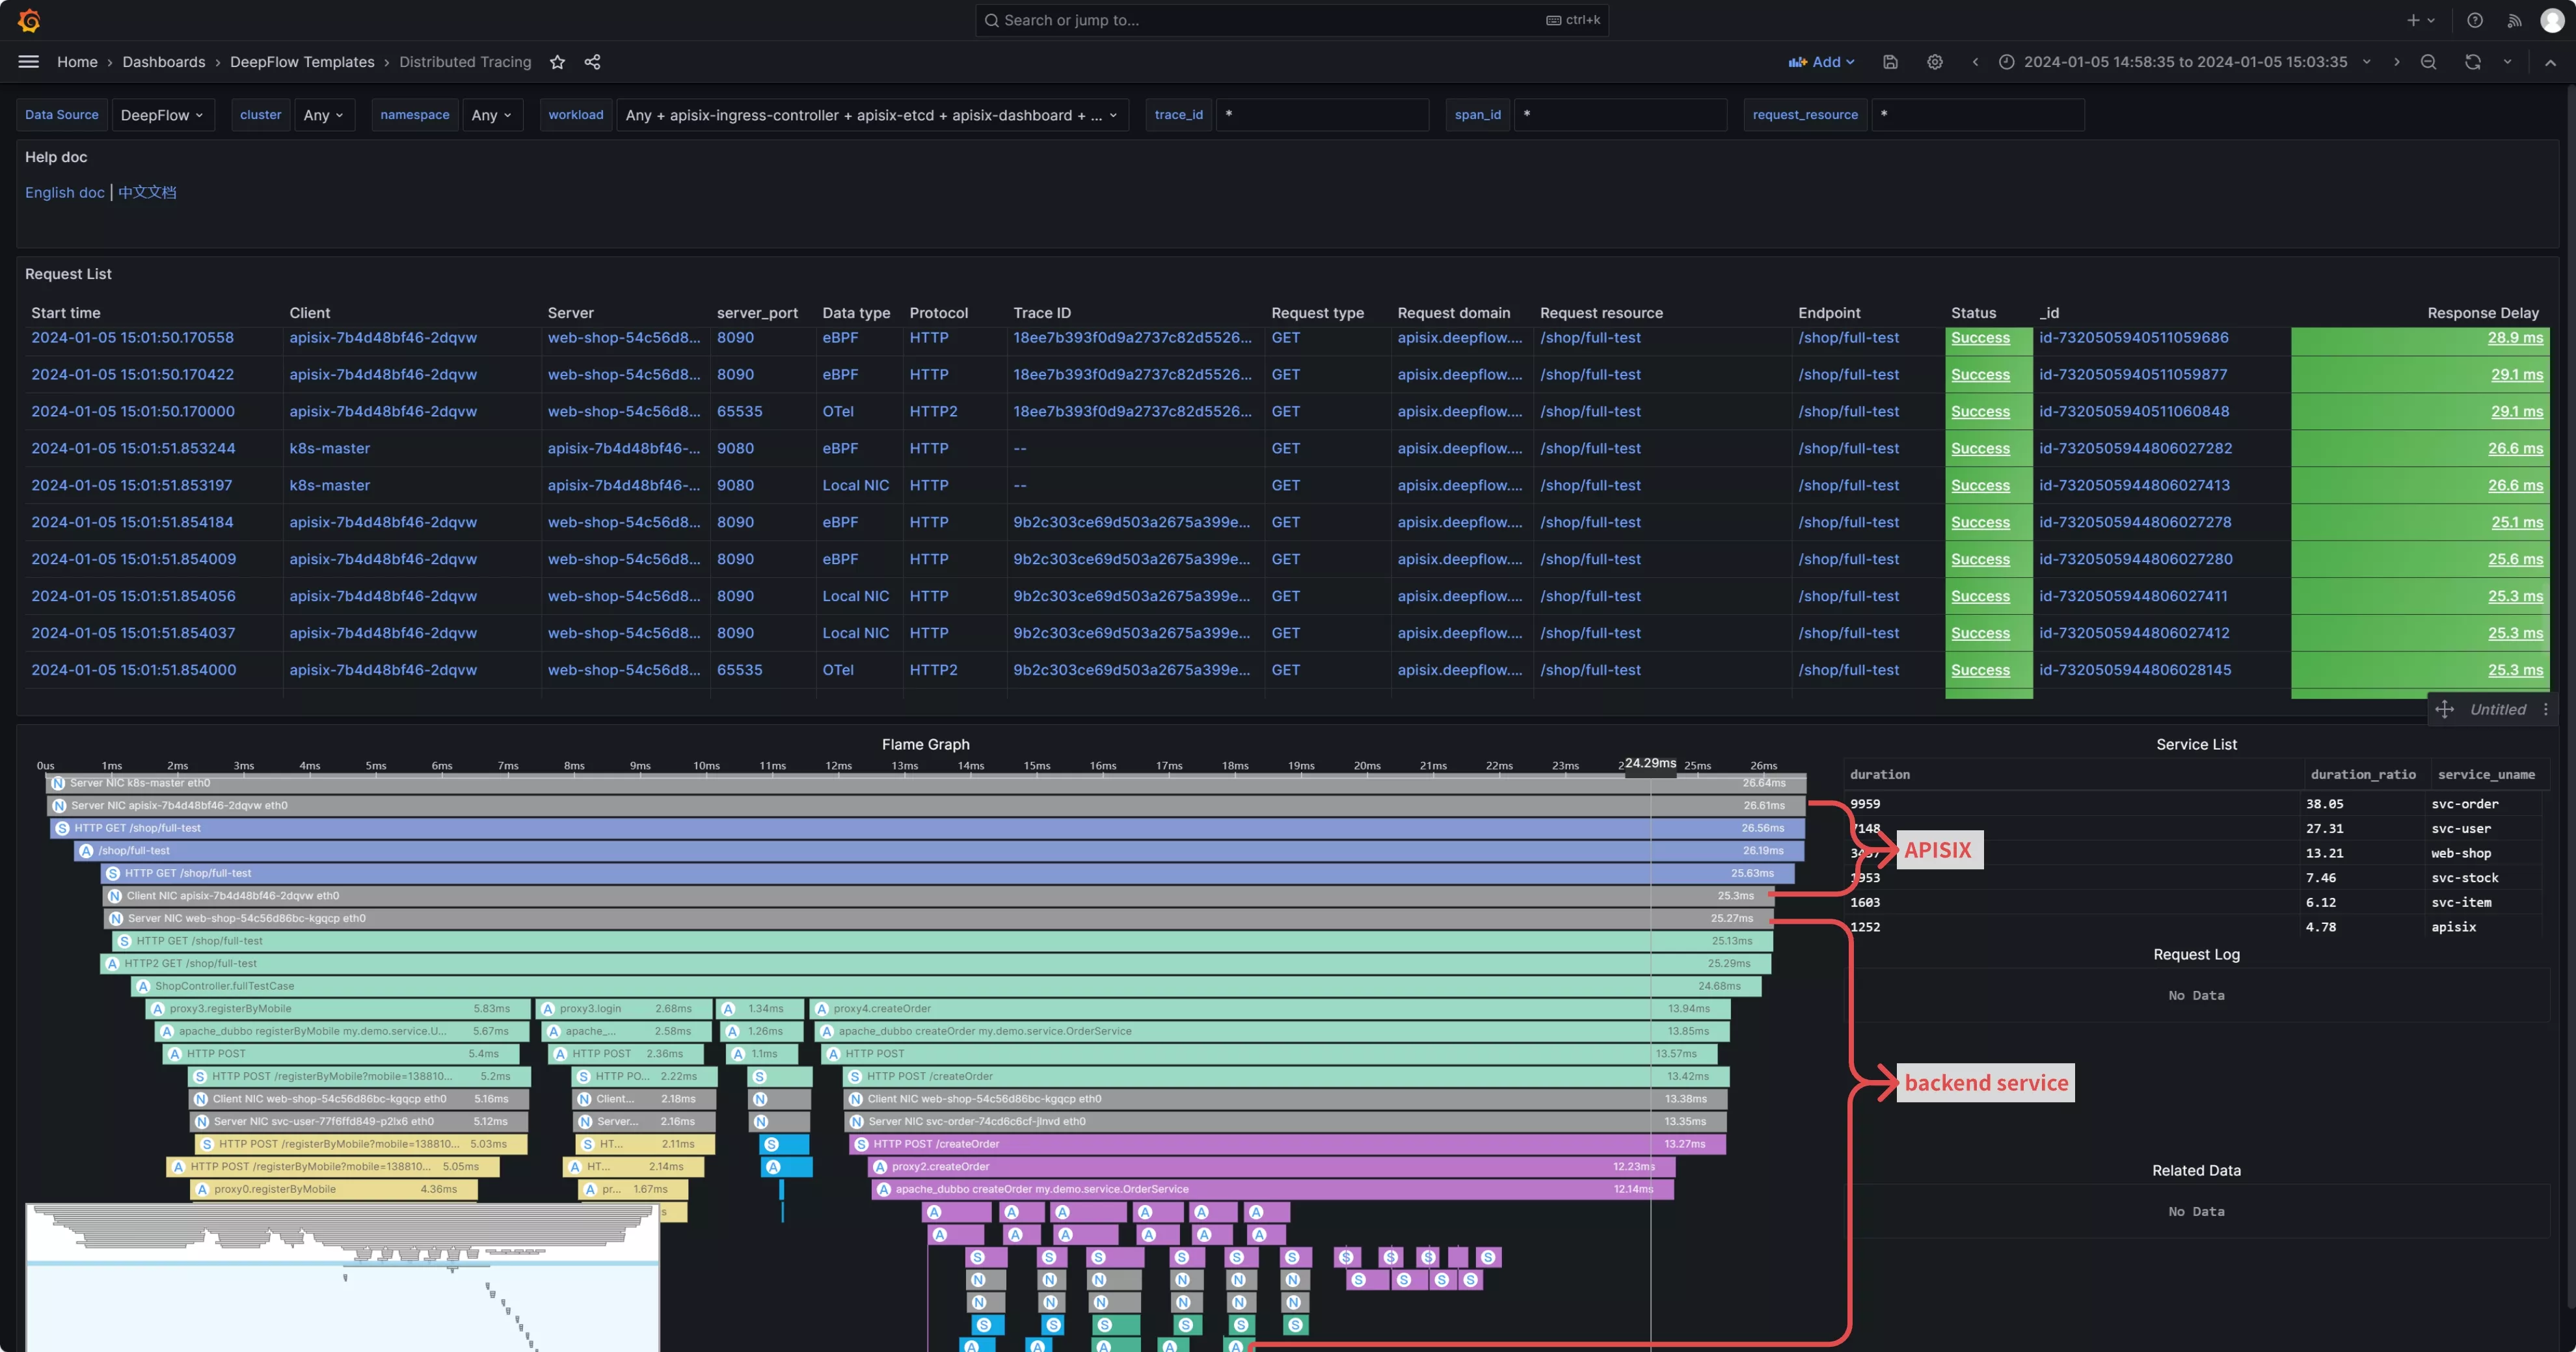
Open the Distributed Tracing Dashboard provided by DeepFlow in Grafana, find the corresponding request, and initiate tracing. You'll be able to see traces from both APISIX and the backend services. Moreover, the application SPANs generated by APM and the network SPANs and system SPANs generated by DeepFlow are all comprehensively associated on one flame graph:
Note: In the flame graph, "A" represents the application SPAN generated by APM, while "N" and "S" represent the network SPAN and system SPAN generated by DeepFlow, respectively.

3. Performance Metrics
DeepFlow offers immediate insights into metrics, featuring detailed RED (Rate, Error, Duration) performance metrics at the endpoint level, along with comprehensive TCP network performance metrics, including throughput, retransmissions, zero window, and connection anomalies. Metrics from APISIX, including HTTP status codes, bandwidth, connections, and latency, captured by Metrics-type plugins like Prometheus and node-status, can also be integrated into DeepFlow. This data, detailing both instance and route granularity, is viewable on the APISIX-provided Grafana Dashboard.


3.1 Out-of-the-Box eBPF Metrics
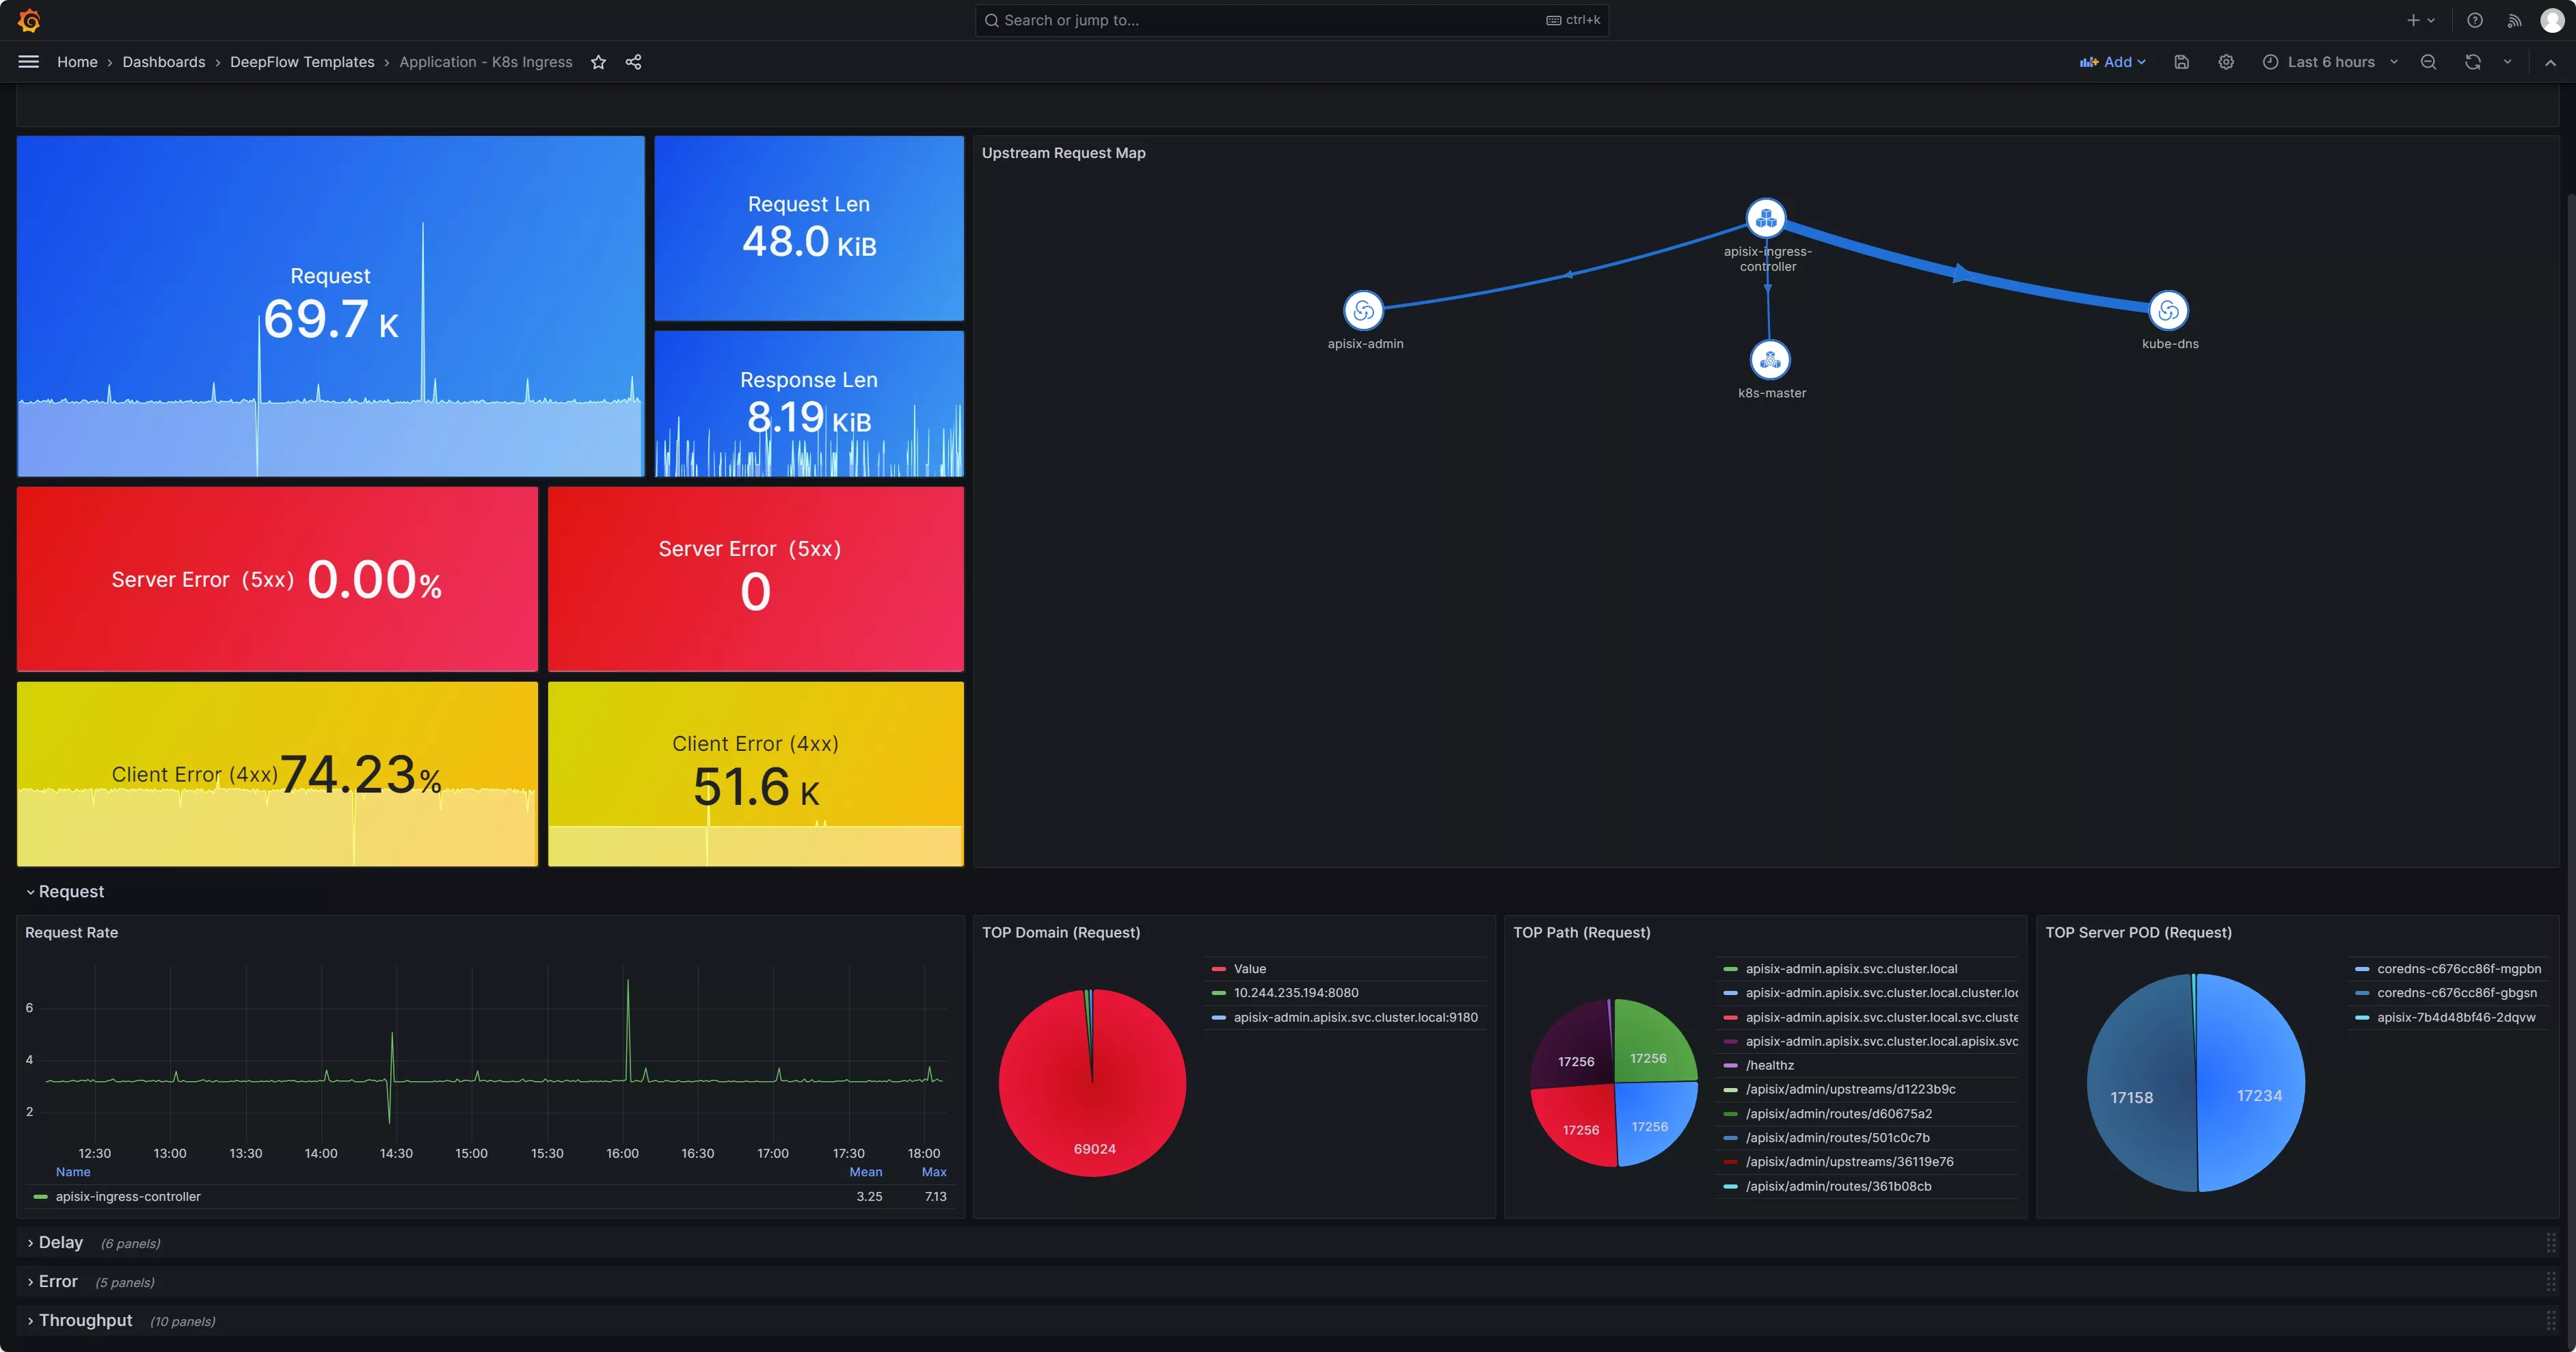
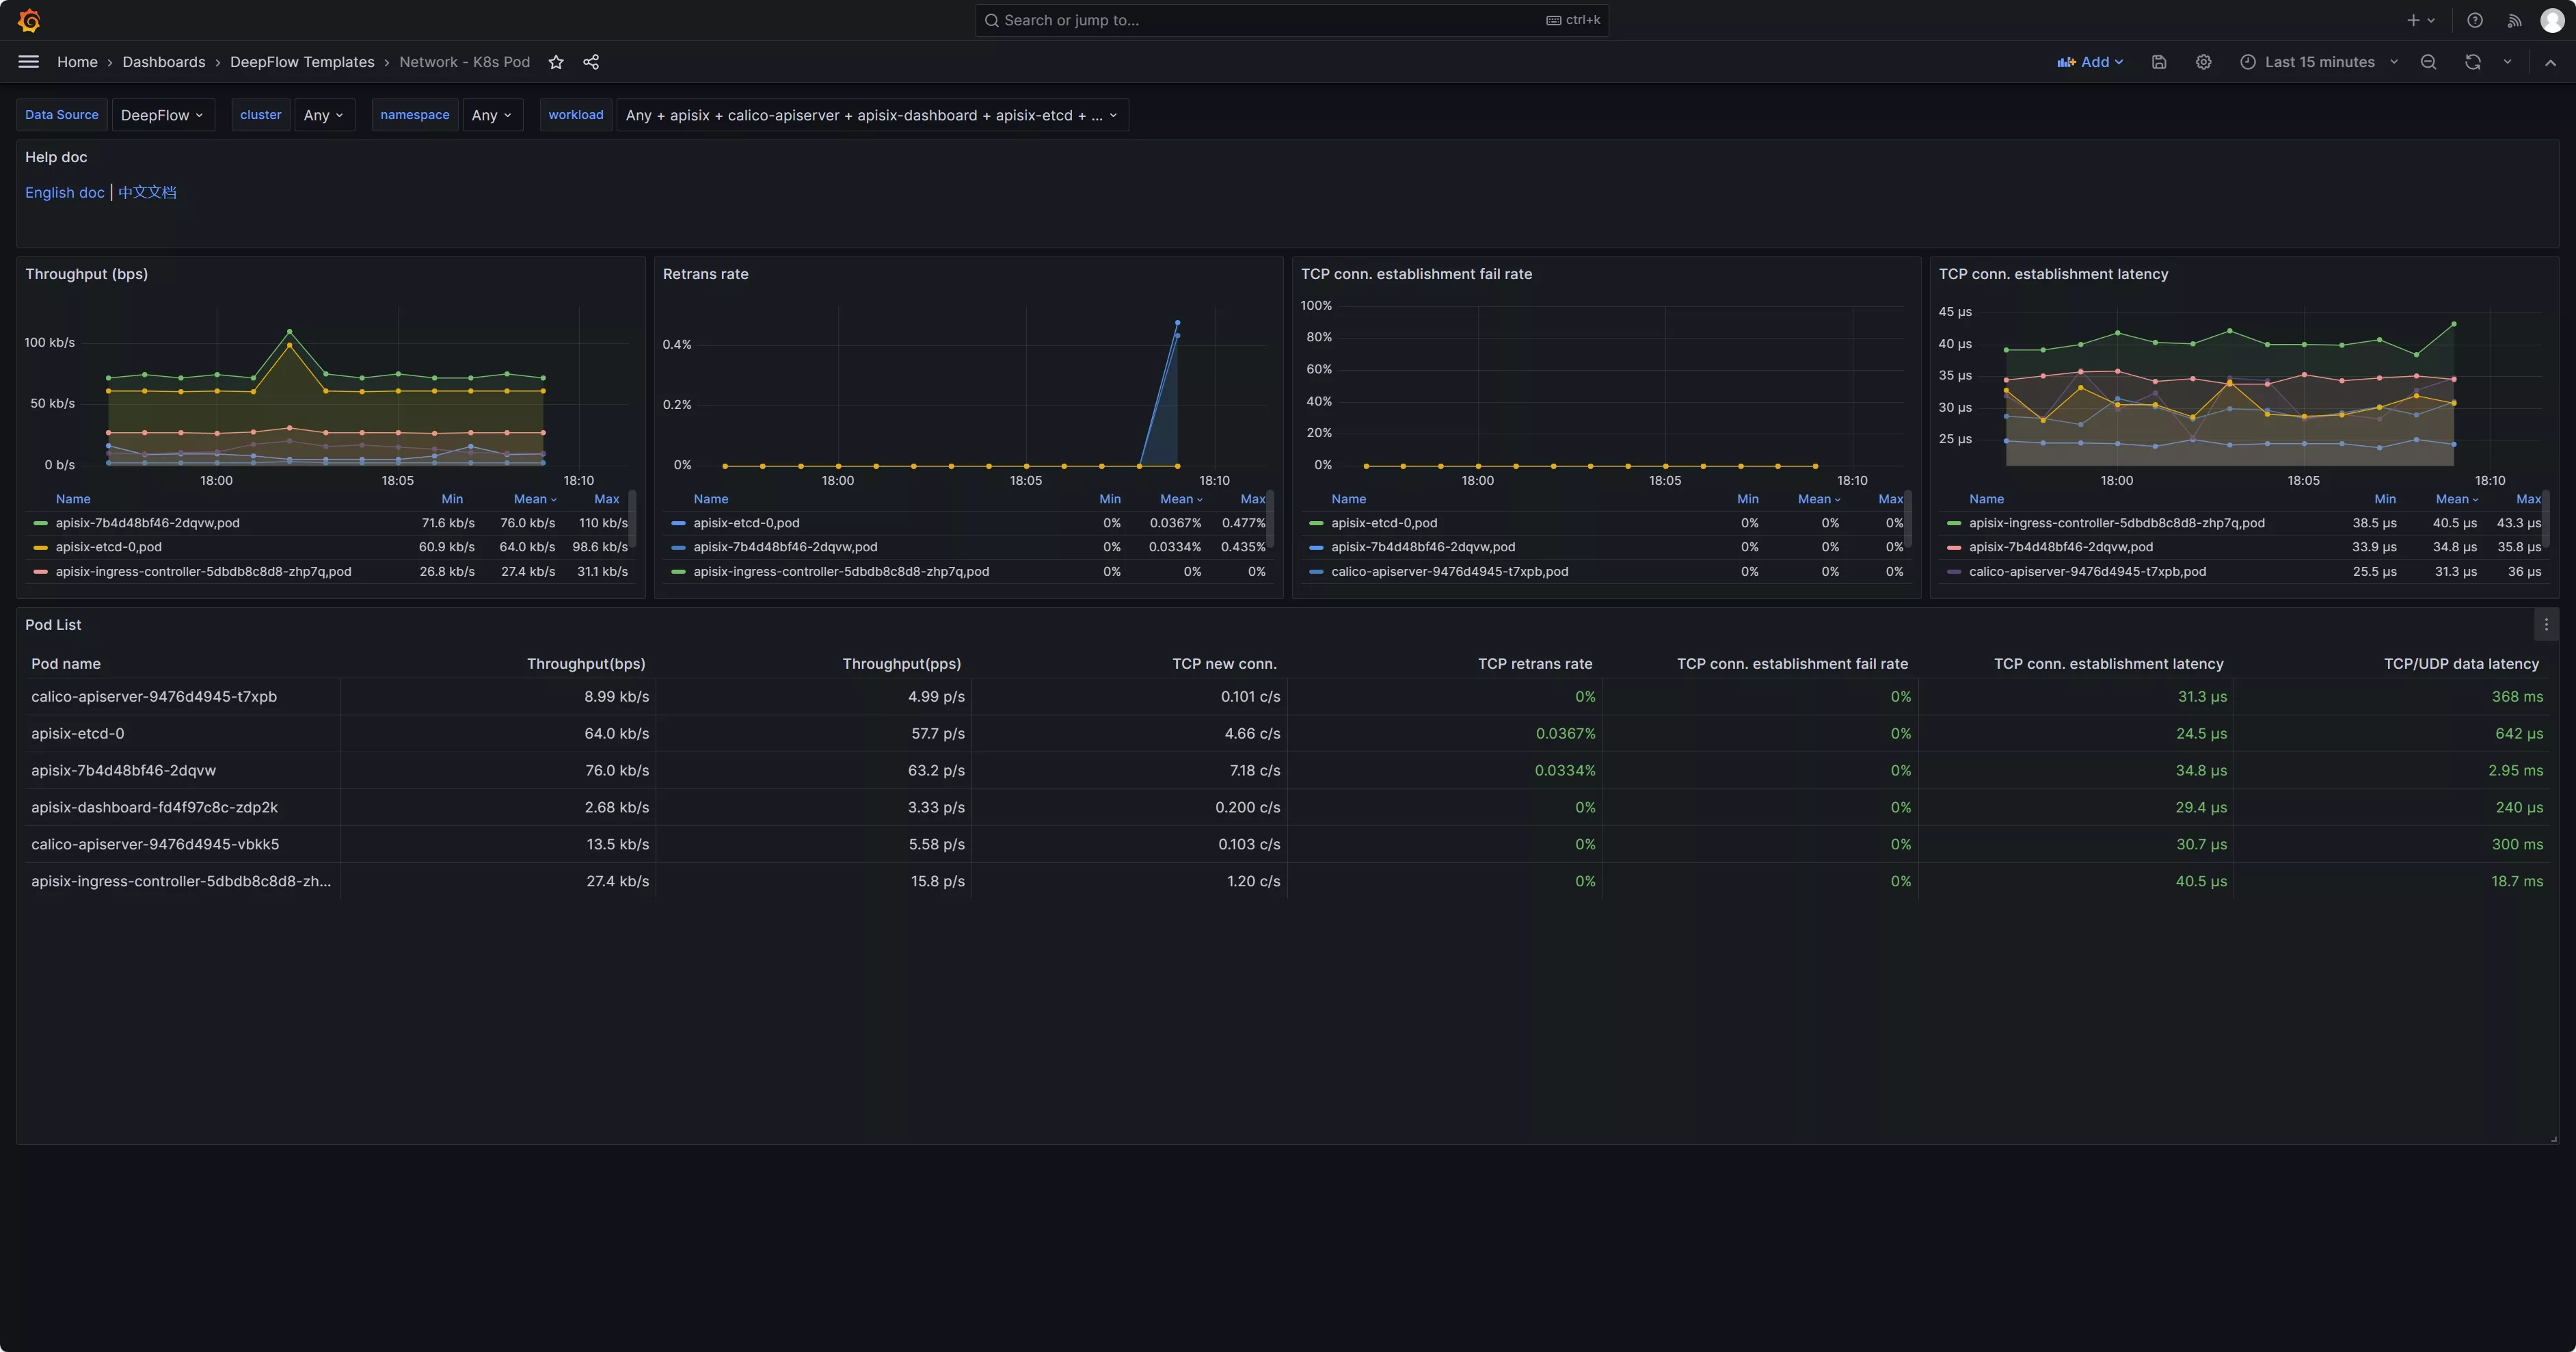
Once the deepflow-agent is deployed on the server hosting APISIX, it automatically gathers highly detailed application and network level metrics. This includes metrics such as request rates, response latencies, and error statuses for specific clients or endpoints, as well as TCP connection setup times, connection anomalies, and more. Detailed metrics can be found on the DeepFlow official website in the metrics section. By opening the Application - K8s Ingress Dashboard provided by DeepFlow in Grafana, you can view application layer performance metrics related to APISIX. Similarly, network-related metrics can be viewed in the Network - K8s Pod Dashboard.


3.2 Enable the Prometheus Plugin in APISIX
Add the Prometheus plugin to the APISIX configuration:
## vim ./apisix/.values.yaml
plugins:
  - prometheus
# ...
pluginAttrs:
  prometheus:
    export_uri: /metrics    ## The default URI is `/apisix/prometheus/metrics`
    export_addr:
      ip: 0.0.0.0           ## Scrape Address
      port: 9091            ## Default port 9091
    metrics:
      http_status:
        extra_labels:
          - upstream_addr: $upstream_addr        ## For example, add an upstream server address (the variable here is an NGINX variable)
          - upstream_status: $upstream_status    ## For example, add the status of an upstream server (the variable here is an NGINX variable)
                                                 ## APISIX Built-in Variables: https://apisix.apache.org/docs/apisix/3.2/apisix-variable/
                                                 ## NGINX Built-in Variables:https://nginx.org/en/docs/varindex.html
Enable Prometheus plugin:
## Note: Since the otel feature has been enabled above, here we need to enable Prometheus on top of the otel functionality.

curl http://10.109.77.186:9180/apisix/admin/routes/$router_id -H 'X-API-KEY: $apisix-admin token' -X PUT -d '
{
    "name": "deepflow-apisix-demo",       ## Assign a name to this route
    "methods": ["GET"],
    "uris": ["/*"],
    "plugins": {
        "prometheus":{                    ## Enable Prometheus
            "prefer_name": true           ## When set to "true," the Prometheus metrics will display the route/service name instead of the ID.
        }
    },
    "upstream": {
        "type": "roundrobin",
        "nodes": {
            "10.1.23.200:18090": 1
        }
    }
}'
3.3 Collect APISIX Metrics with Prometheus
Collecting APISIX metrics using Prometheus (example given using Prometheus CRD deployment method):
## Collecting via ServiceMonitor Method (Prometheus deployed in Kubernetes as a CRD)
## The APISIX `values.yaml` file provides the corresponding module
serviceMonitor:
  ## Whether to enable
  enabled: true
  ## Which namespace to create in
      namespace: "apisix"
  ## ServiceMonitor name, defaults to fullname
  name: ""
  ## Scrape interval
  interval: 15s
  ## URI where metrics are exposed
  path: /metrics
  ## Prefix for the scraped metrics
  metricPrefix: apisix_
  ## Scrape port
  containerPort: 9091
  ## Add labels
  labels:
    ## For this deployment, the project uses kube-prometheus; use this label for kube-prometheus to recognize the ServiceMonitor
    app.kubernetes.io/part-of: kube-prometheus
  annotations: {}
At this point, a Prometheus backend service is required to collect the metrics generated by APISIX plugins. Therefore, it is necessary to deploy a prometheus-server first. However, since these metrics do not rely on prometheus-server for storage, it is possible to deploy a prometheus-server in agent mode or use a lighter weight grafana-agent instead. Assuming that prometheus-server has been deployed, enabling RemoteWrite will send metric data to DeepFlow:
## https://prometheus.io/docs/prometheus/latest/configuration/configuration/#remote_write
## https://deepflow.io/docs/zh/integration/input/metrics/prometheus/#配置-remote-write

## Sending to DeepFlow via kube-prometheus (adding remote write in the YAML manifest)
apiVersion: monitoring.coreos.com/v1
kind: Prometheus
metadata:
  labels:
    ...
  name: k8s
  namespace: monitoring
spec:
  enableRemoteWriteReceiver: true
  remoteWrite:
    ## Note: Here should be the deepflow-agent service address, which needs to be specified according to the actual location.
    - url: "http://deepflow-agent.deepflow.svc.cluster.local/api/v1/prometheus"
3.4 Integrating Prometheus Metrics with DeepFlow
Integrating Prometheus metrics through deepflow-agent is enabled by default and requires no additional configuration.
## View the default configuration of deepflow-agent
## deepflow-ctl agent-group-config example

## This parameter controls whether to accept data from external sources, including Prometheus, Telegraf, OpenTelemetry, and SkyWalking.
## Data Integration Socket
## Default: 1. Options: 0 (disabled), 1 (enabled).
## Note: Whether to enable receiving external data sources such as Prometheus,
##   Telegraf, OpenTelemetry, and SkyWalking.
#external_agent_http_proxy_enabled: 1
3.5 Prometheus Integration Showcase
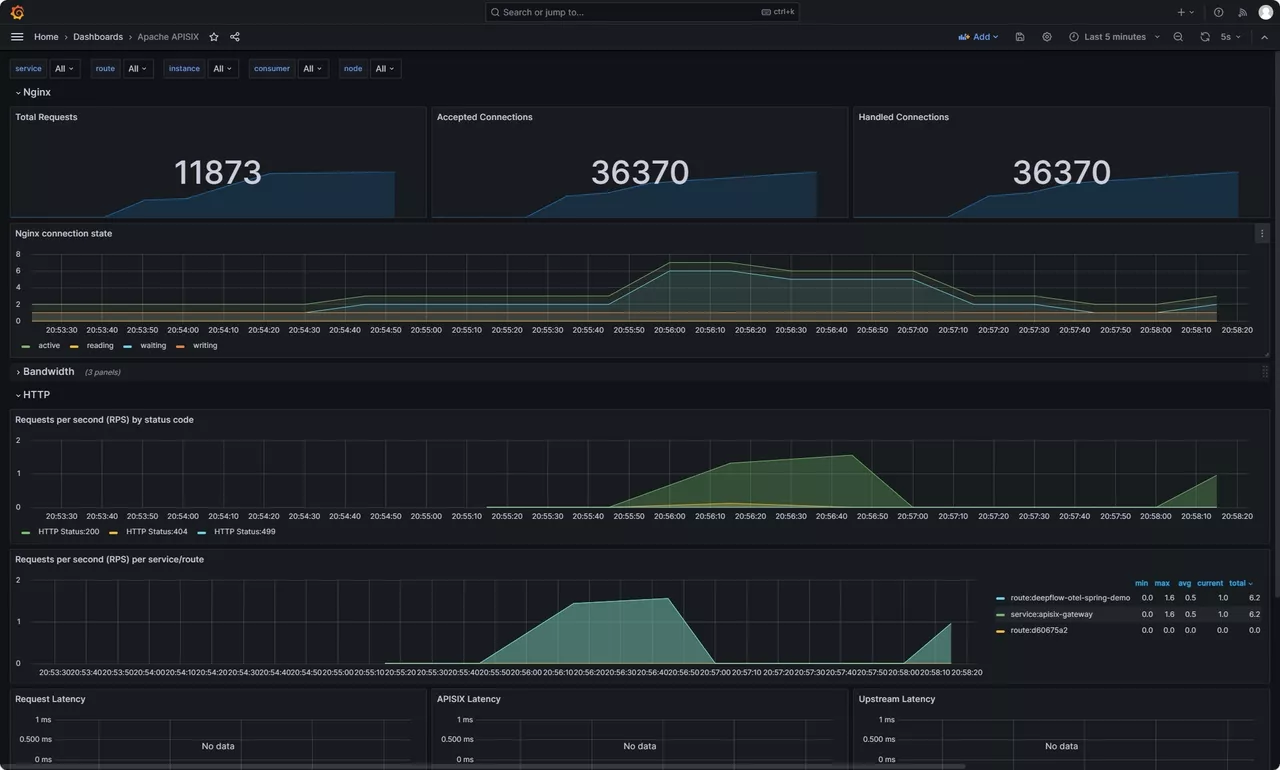
Since DeepFlow supports PromQL, you only need to change the data-source in the Grafana dashboard provided by APISIX to DeepFlow. This way, you can view the rich performance metrics natively provided by APISIX. For instructions on how to use these metrics, refer to the official documentation regarding the Prometheus plugin.

4. Access Logs and Continuous Profiling


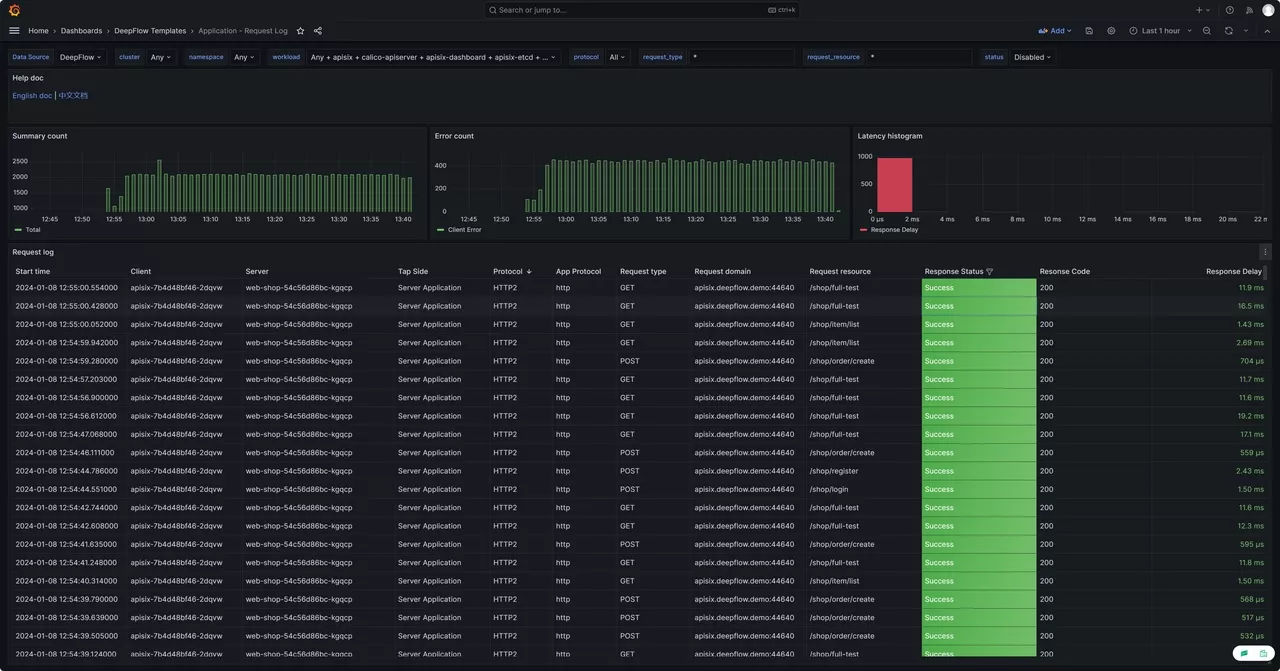
For access logs, there is no need for APISIX to be modified in any way. Simply deploying deepflow-agent on the server where APISIX is located. By opening the Application - Request Log Dashboard provided by DeepFlow in Grafana, you can view the access logs, which include header information from both the Request and Response. Additionally, you can analyze the response latency and error codes for each request.

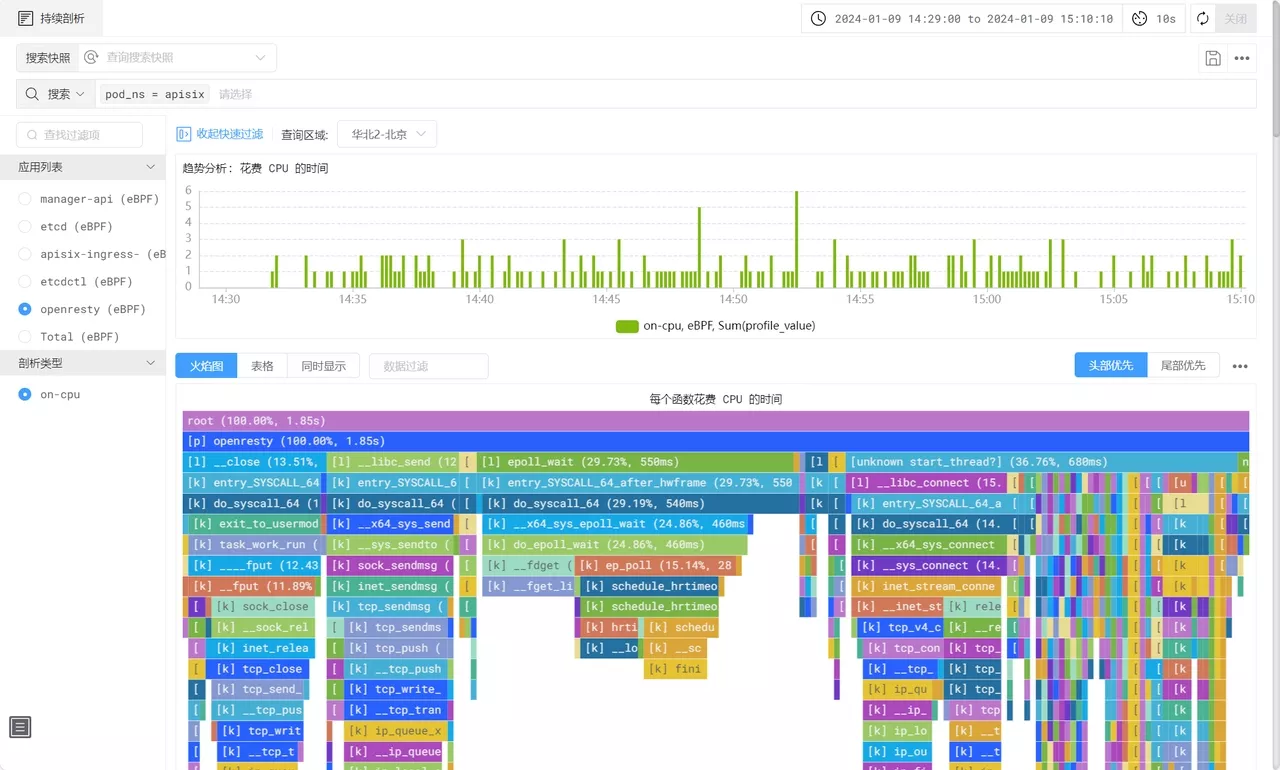
DeepFlow also utilizes eBPF to capture function call stacks of applications, a feature available in the enterprise edition. This functionality enables the generation of an On-CPU Profile for the APISIX process, detailing the function call stack. It encompasses not just application functions but also the time spent in libraries and kernel syscalls.

5. What is APISIX
Apache APISIX is a dynamic, real-time, high-performance open-source API gateway that provides rich traffic management functions such as load balancing, dynamic upstream, canary release, circuit breaking, authentication, and observability. Being built based on NGINX and LuaJIT, Apache APISIX has ultra-high performance with a single-core QPS of up to 23,000 and an average delay of only 0.2 milliseconds. It can solve problems in traditional architecture, and at the same time adapt to the needs of the cloud-native era.
As an API gateway, Apache APISIX has a wide range of application scenarios. It can be applied to scenarios such as gateways, Kubernetes Ingress Controller, and service mesh, and can help enterprises quickly and safely process API and microservice traffic. At present, it has been tested and highly recognized by worldwide enterprises and organizations such as Zoom, Airwallex, Lotus Cars, vivo, and European Factory Platform.
Open-sourced and donated by API7.ai to Apache Software Foundation in 2019, Apache APISIX is now the most active API gateway project on GitHub addressing 1 Trillion+ API calls per day, which is still growing.
GitHub address:https://github.com/apache/apisix
6. What is DeepFlow
DeepFlow, an open-source observability project, aims to deliver comprehensive observability for complex cloud infrastructures and cloud-native applications. Utilizing eBPF technology, it offers application performance metrics, distributed tracing, and continuous profiling with zero-code instrumentation, thanks to its integration of smart-encoding technology for full-stack correlation. DeepFlow enables automatic deep observability for cloud-native applications, easing developers' workload and equipping DevOps/SRE teams with advanced monitoring and diagnostic tools that span from code to infrastructure.
GitHub address:https://github.com/deepflowio/deepflow