skywalking
Description#
The skywalking Plugin supports the integrating with Apache SkyWalking for request tracing.
SkyWalking uses its native Nginx Lua tracer to provide tracing, topology analysis, and metrics from both service and URI perspectives. APISIX supports HTTP protocol to interact with the SkyWalking server.
The server currently supports two protocols: HTTP and gRPC. In APISIX, only HTTP is currently supported.
Static Configurations#
By default, service names and endpoint address for the Plugin are pre-configured in the default configuration.
To customize these values, add the corresponding configurations to config.yaml. For example:
plugin_attr:
  skywalking:
    report_interval: 3      # Reporting interval time in seconds.
    service_name: APISIX    # Service name for SkyWalking reporter.
    service_instance_name: "APISIX Instance Name"   # Service instance name for SkyWalking reporter.
                                                    # Set to $hostname to get the local hostname.
    endpoint_addr: http://127.0.0.1:12800           # SkyWalking HTTP endpoint.
Reload APISIX for changes to take effect.
Attributes#
| Name | Type | Required | Default | Valid values | Description |
|---|---|---|---|---|---|
| sample_ratio | number | True | 1 | [0.00001, 1] | Frequency of request sampling. Setting the sample ratio to 1 means to sample all requests. |
Example#
To follow along the example, start a storage, OAP and Booster UI with Docker Compose, following Skywalking's documentation. Once set up, the OAP server should be listening on 12800 and you should be able to access the UI at http://localhost:8080.
Update APISIX configuration file to enable the skywalking plugin, which is disabled by default, and update the endpoint address:
plugins:
  - skywalking
  - ...

plugin_attr:
  skywalking:
    report_interval: 3
    service_name: APISIX
    service_instance_name: APISIX Instance
    endpoint_addr: http://192.168.2.103:12800
Reload APISIX for configuration changes to take effect.
note
You can fetch the admin_key from config.yaml and save to an environment variable with the following command:
admin_key=$(yq '.deployment.admin.admin_key[0].key' conf/config.yaml | sed 's/"//g')
Trace All Requests#
The following example demonstrates how you can trace all requests passing through a Route.
Create a Route with skywalking and configure the sampling ratio to be 1 to trace all requests:
curl "http://127.0.0.1:9180/apisix/admin/routes" -X PUT \
  -H "X-API-KEY: ${admin_key}" \
  -d '{
    "id": "skywalking-route",
    "uri": "/anything",
    "plugins": {
      "skywalking": {
        "sample_ratio": 1
      }
    },
    "upstream": {
      "nodes": {
        "httpbin.org:80": 1
      },
      "type": "roundrobin"
    }
  }'
Send a few requests to the Route:
curl -i "http://127.0.0.1:9080/anything"
You should receive HTTP/1.1 200 OK responses.
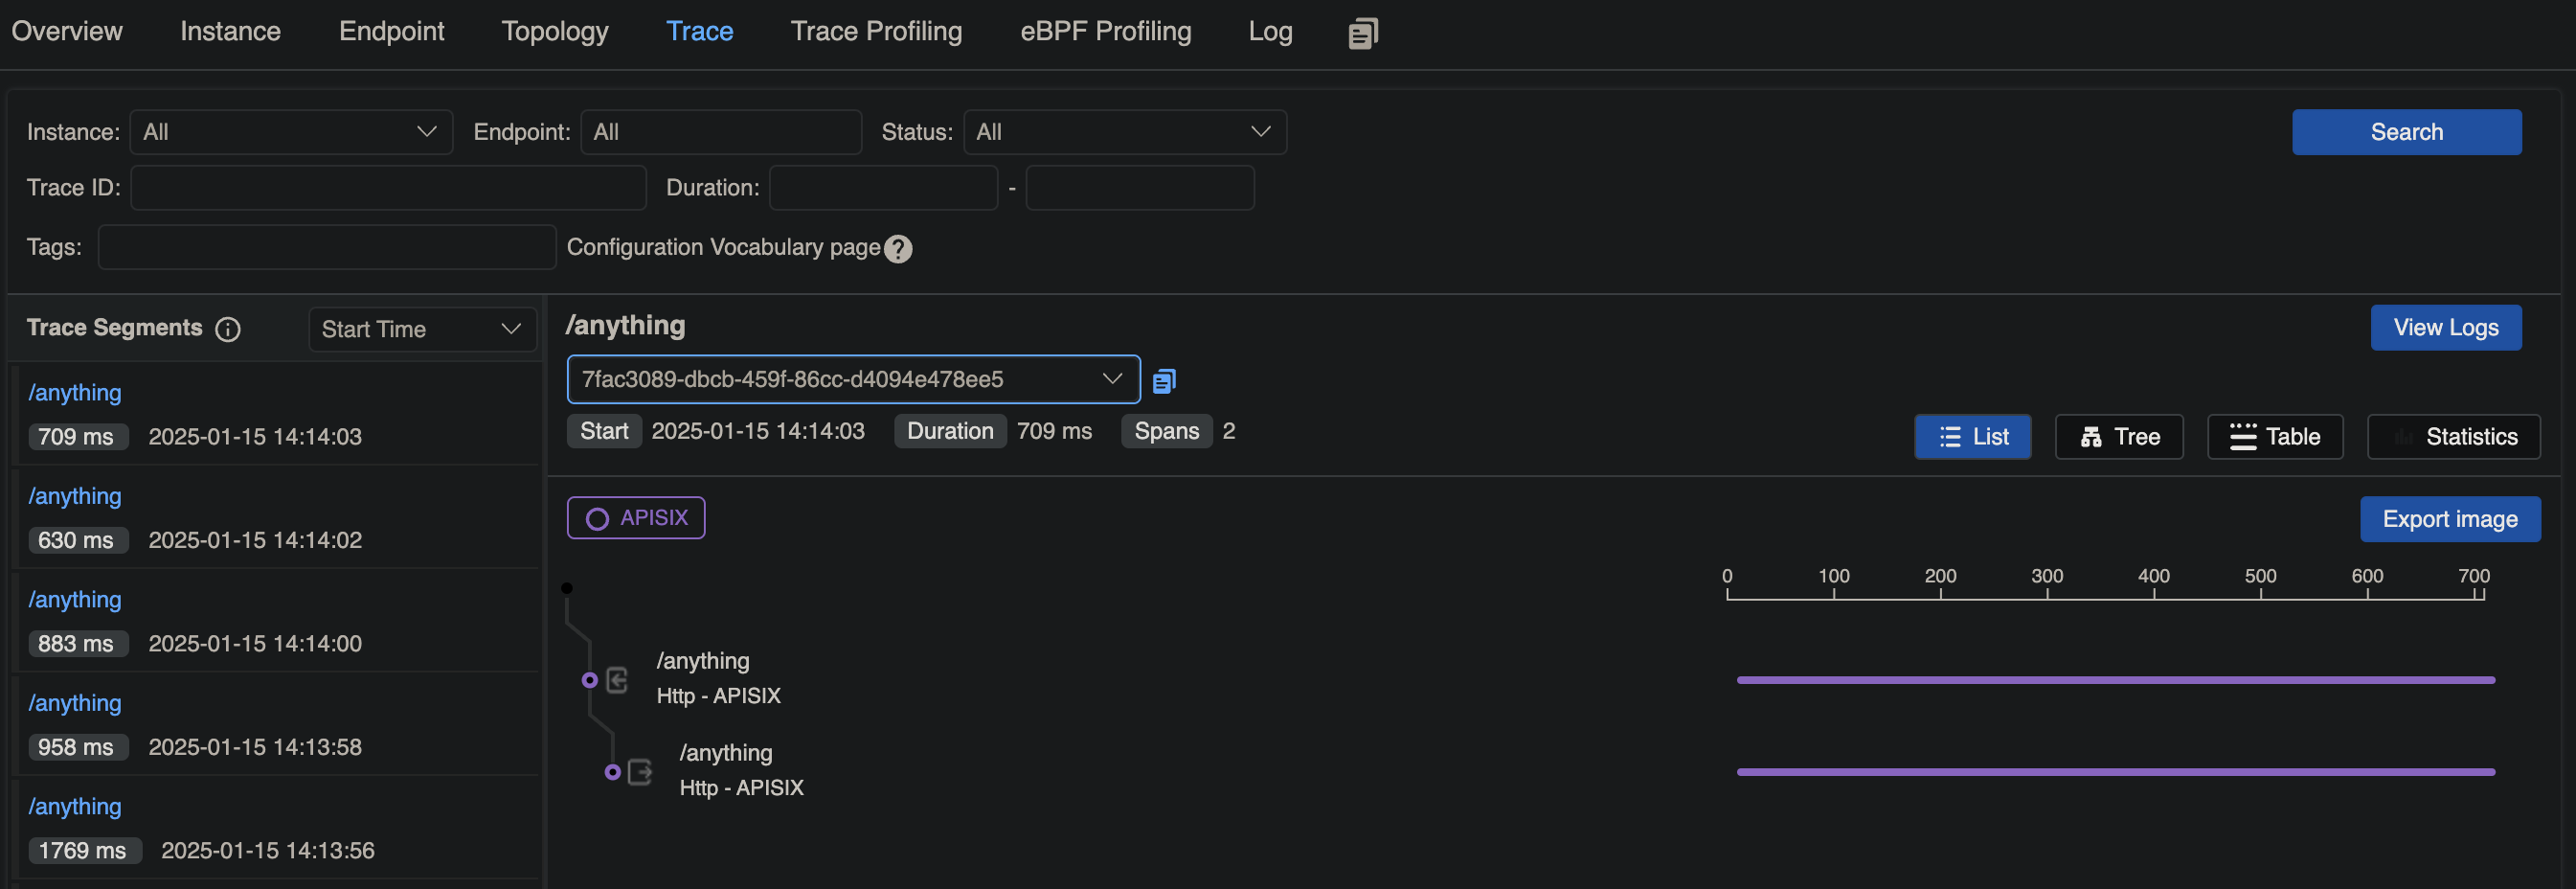
In Skywalking UI, navigate to General Service > Services. You should see a service called APISIX with traces corresponding to your requests:
Associate Traces with Logs#
The following example demonstrates how you can configure the skywalking-logger Plugin on a Route to log information of requests hitting the Route.
Create a Route with the skywalking-logger Plugin and configure the Plugin with your OAP server URI:
curl "http://127.0.0.1:9180/apisix/admin/routes" -X PUT \
  -H "X-API-KEY: ${admin_key}" \
  -d '{
    "id": "skywalking-logger-route",
    "uri": "/anything",
    "plugins": {
      "skywalking": {
        "sample_ratio": 1
      },
      "skywalking-logger": {
        "endpoint_addr": "http://192.168.2.103:12800"
      }
    },
    "upstream": {
      "nodes": {
        "httpbin.org:80": 1
      },
      "type": "roundrobin"
    }
  }'
Generate a few requests to the Route:
curl -i "http://127.0.0.1:9080/anything"
You should receive HTTP/1.1 200 OK responses.
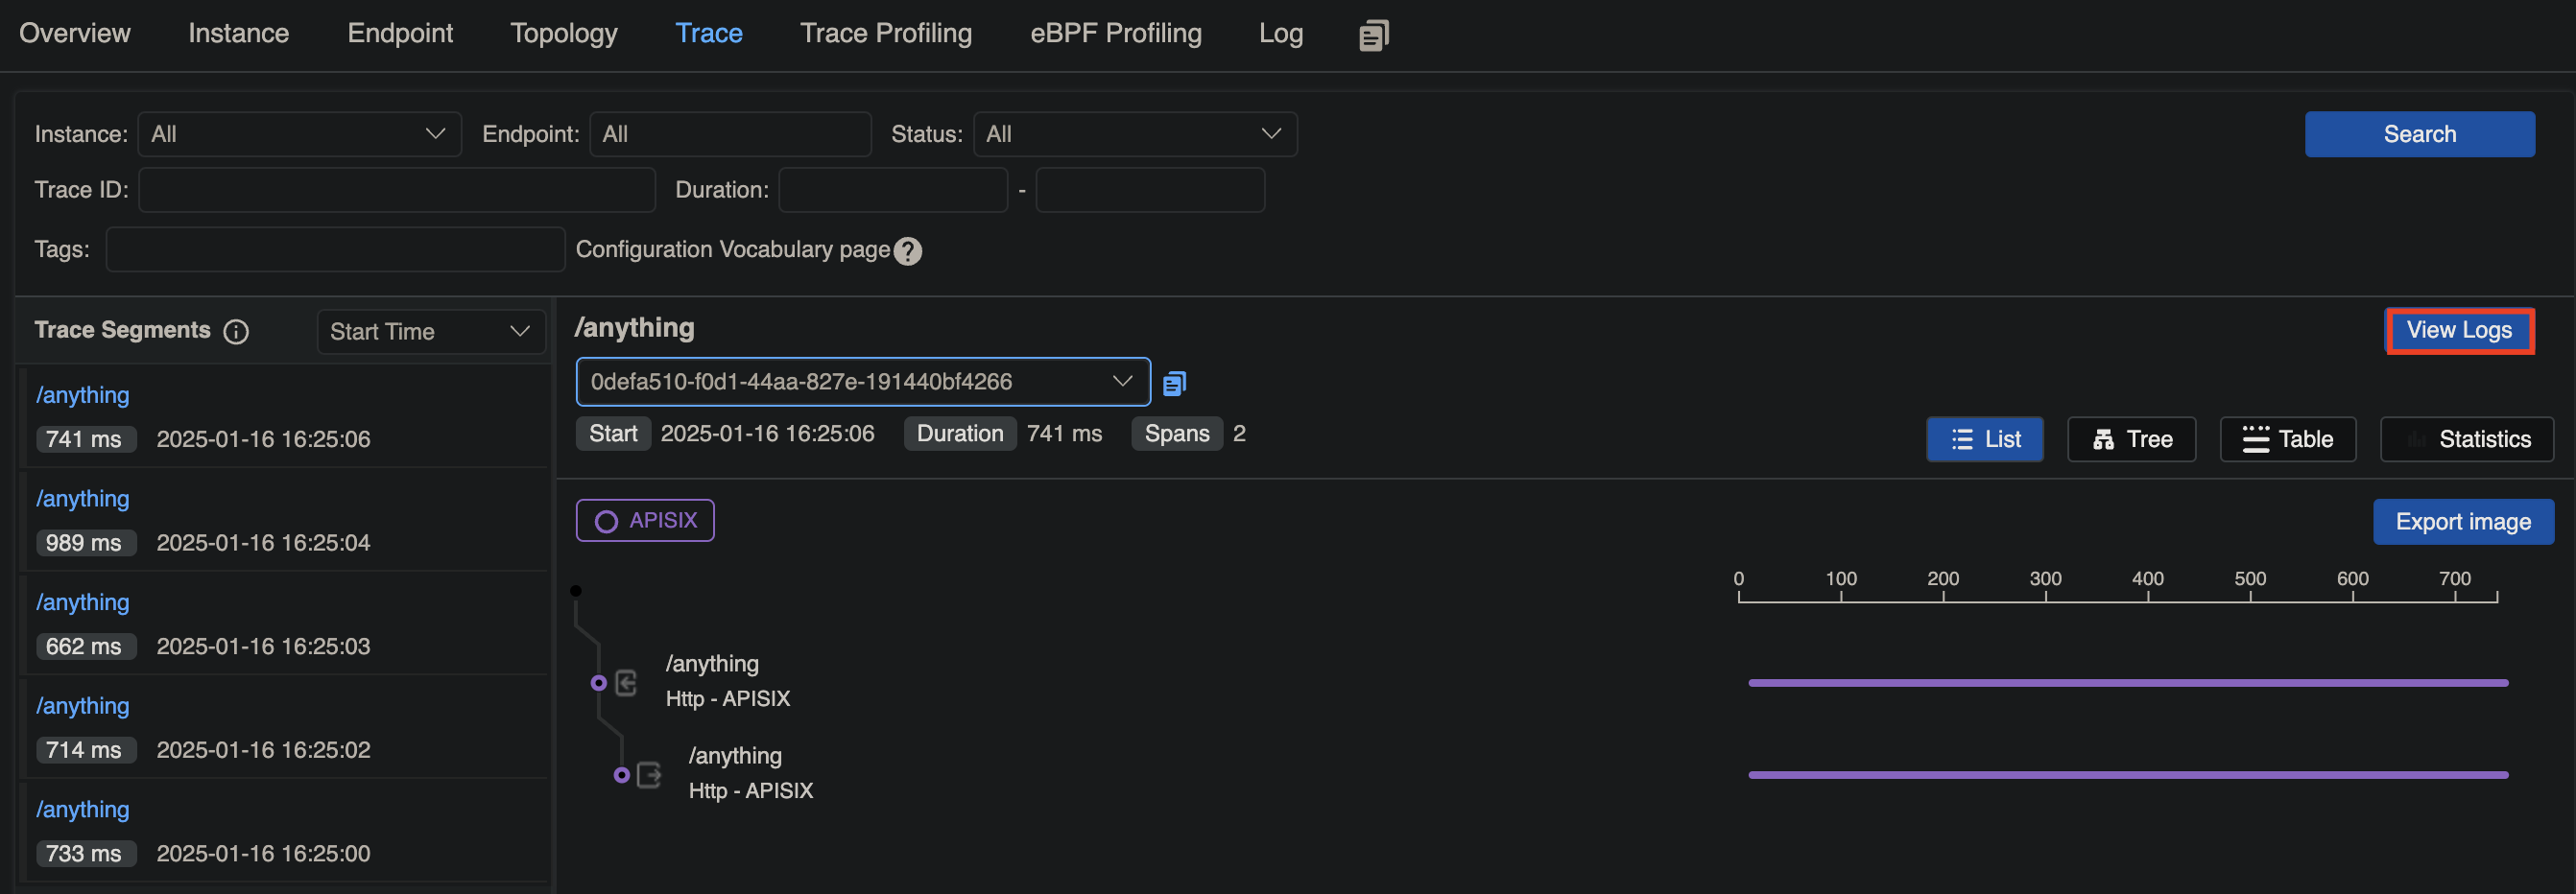
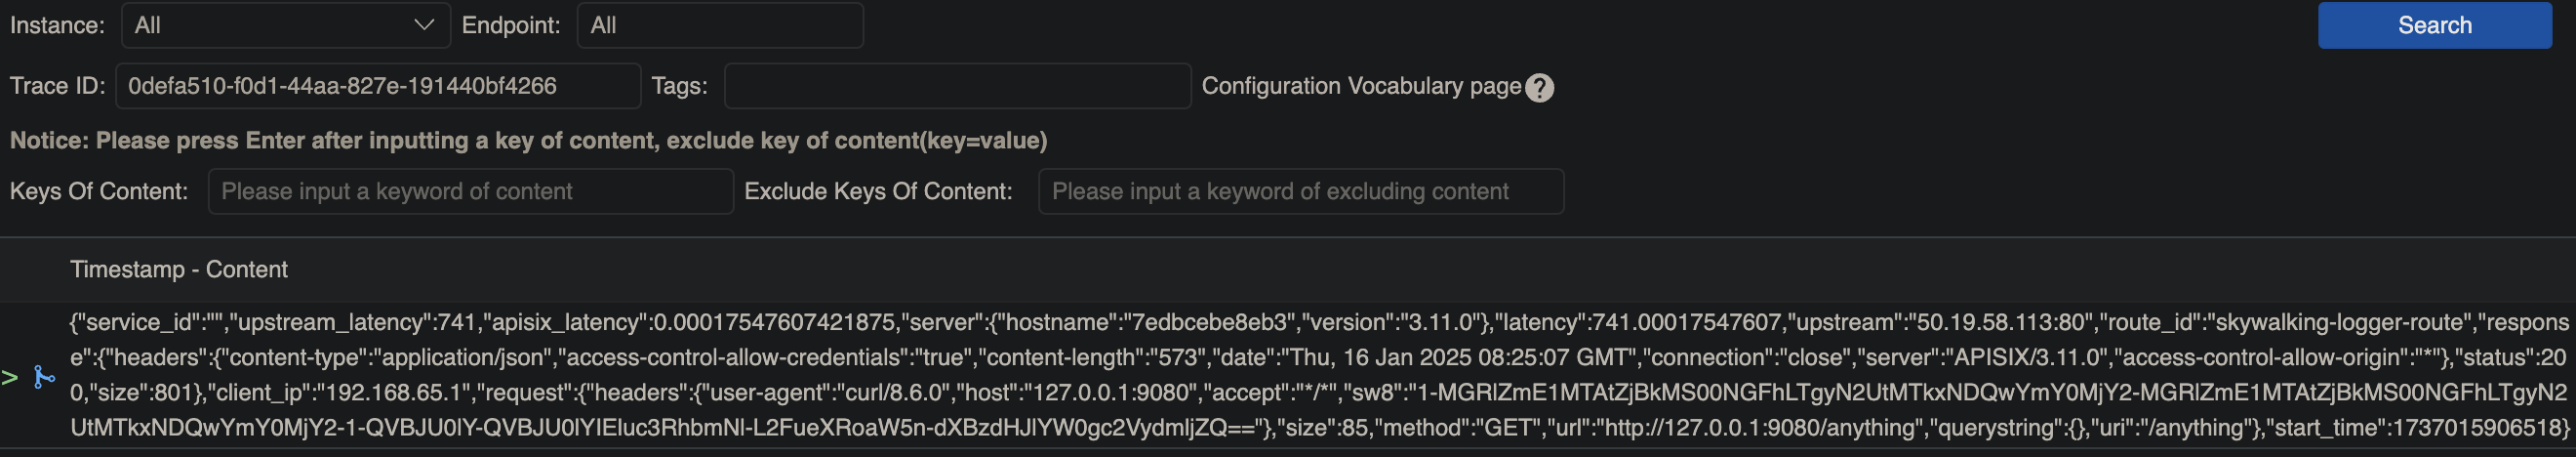
In Skywalking UI, navigate to General Service > Services. You should see a service called APISIX with a trace corresponding to your request, where you can view the associated logs: